Creek vs Immigrants from Jamaica Unemployment Among Ages 20 to 24 years
COMPARE
Creek
Immigrants from Jamaica
Unemployment Among Ages 20 to 24 years
Unemployment Among Ages 20 to 24 years Comparison
Creek
Immigrants from Jamaica
9.7%
UNEMPLOYMENT AMONG AGES 20 TO 24 YEARS
99.8/ 100
METRIC RATING
49th/ 347
METRIC RANK
13.0%
UNEMPLOYMENT AMONG AGES 20 TO 24 YEARS
0.0/ 100
METRIC RATING
321st/ 347
METRIC RANK
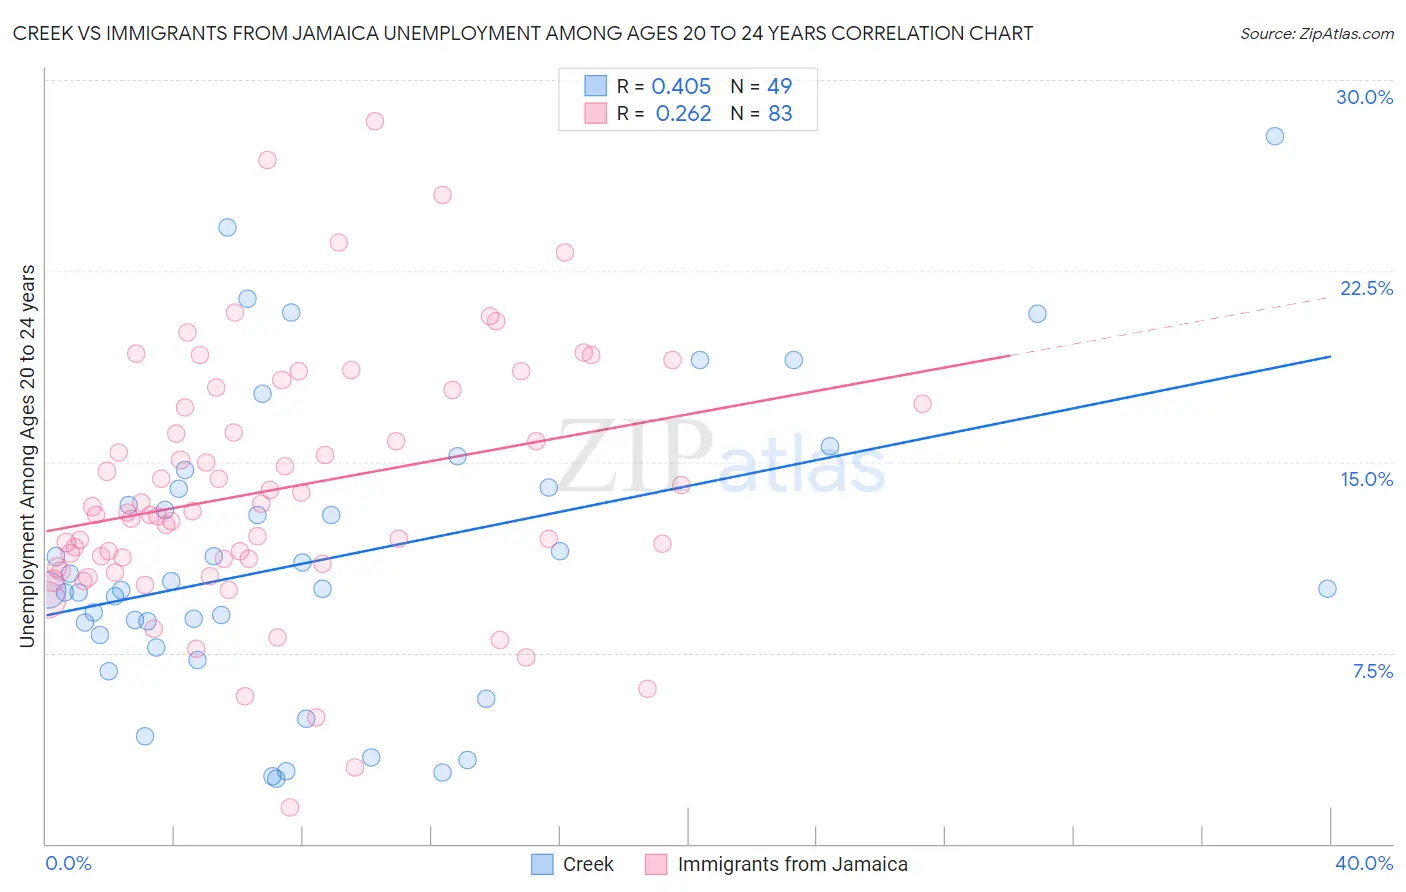
Creek vs Immigrants from Jamaica Unemployment Among Ages 20 to 24 years Correlation Chart
The statistical analysis conducted on geographies consisting of 174,635,807 people shows a moderate positive correlation between the proportion of Creek and unemployment rate among population between the ages 20 and 24 in the United States with a correlation coefficient (R) of 0.405 and weighted average of 9.7%. Similarly, the statistical analysis conducted on geographies consisting of 295,465,430 people shows a weak positive correlation between the proportion of Immigrants from Jamaica and unemployment rate among population between the ages 20 and 24 in the United States with a correlation coefficient (R) of 0.262 and weighted average of 13.0%, a difference of 33.2%.
Unemployment Among Ages 20 to 24 years Correlation Summary
| Measurement | Creek | Immigrants from Jamaica |
| Minimum | 2.5% | 1.4% |
| Maximum | 27.8% | 28.4% |
| Range | 25.3% | 27.0% |
| Mean | 11.2% | 13.9% |
| Median | 10.0% | 13.0% |
| Interquartile 25% (IQ1) | 8.0% | 11.0% |
| Interquartile 75% (IQ3) | 14.0% | 17.3% |
| Interquartile Range (IQR) | 6.0% | 6.3% |
| Standard Deviation (Sample) | 5.8% | 5.0% |
| Standard Deviation (Population) | 5.7% | 5.0% |
Similar Demographics by Unemployment Among Ages 20 to 24 years
Demographics Similar to Creek by Unemployment Among Ages 20 to 24 years
In terms of unemployment among ages 20 to 24 years, the demographic groups most similar to Creek are Finnish (9.7%, a difference of 0.080%), Immigrants from India (9.7%, a difference of 0.090%), Immigrants from Kenya (9.7%, a difference of 0.14%), Immigrants from Nicaragua (9.7%, a difference of 0.21%), and Ethiopian (9.8%, a difference of 0.21%).
| Demographics | Rating | Rank | Unemployment Among Ages 20 to 24 years |
| Immigrants | Saudi Arabia | 99.9 /100 | #42 | Exceptional 9.7% |
| Menominee | 99.8 /100 | #43 | Exceptional 9.7% |
| Europeans | 99.8 /100 | #44 | Exceptional 9.7% |
| Croatians | 99.8 /100 | #45 | Exceptional 9.7% |
| Immigrants | Nicaragua | 99.8 /100 | #46 | Exceptional 9.7% |
| Immigrants | India | 99.8 /100 | #47 | Exceptional 9.7% |
| Finns | 99.8 /100 | #48 | Exceptional 9.7% |
| Creek | 99.8 /100 | #49 | Exceptional 9.7% |
| Immigrants | Kenya | 99.7 /100 | #50 | Exceptional 9.7% |
| Ethiopians | 99.7 /100 | #51 | Exceptional 9.8% |
| Immigrants | Thailand | 99.7 /100 | #52 | Exceptional 9.8% |
| Immigrants | Serbia | 99.6 /100 | #53 | Exceptional 9.8% |
| Immigrants | Cambodia | 99.6 /100 | #54 | Exceptional 9.8% |
| Carpatho Rusyns | 99.6 /100 | #55 | Exceptional 9.8% |
| Nicaraguans | 99.6 /100 | #56 | Exceptional 9.8% |
Demographics Similar to Immigrants from Jamaica by Unemployment Among Ages 20 to 24 years
In terms of unemployment among ages 20 to 24 years, the demographic groups most similar to Immigrants from Jamaica are Cheyenne (13.0%, a difference of 0.080%), Native/Alaskan (13.0%, a difference of 0.38%), Trinidadian and Tobagonian (12.9%, a difference of 0.51%), Barbadian (12.9%, a difference of 0.76%), and Yakama (13.1%, a difference of 0.86%).
| Demographics | Rating | Rank | Unemployment Among Ages 20 to 24 years |
| Blacks/African Americans | 0.0 /100 | #314 | Tragic 12.7% |
| West Indians | 0.0 /100 | #315 | Tragic 12.8% |
| Immigrants | Dominica | 0.0 /100 | #316 | Tragic 12.8% |
| Immigrants | Trinidad and Tobago | 0.0 /100 | #317 | Tragic 12.8% |
| Barbadians | 0.0 /100 | #318 | Tragic 12.9% |
| Trinidadians and Tobagonians | 0.0 /100 | #319 | Tragic 12.9% |
| Cheyenne | 0.0 /100 | #320 | Tragic 13.0% |
| Immigrants | Jamaica | 0.0 /100 | #321 | Tragic 13.0% |
| Natives/Alaskans | 0.0 /100 | #322 | Tragic 13.0% |
| Yakama | 0.0 /100 | #323 | Tragic 13.1% |
| Alaska Natives | 0.0 /100 | #324 | Tragic 13.2% |
| Pueblo | 0.0 /100 | #325 | Tragic 13.2% |
| Immigrants | Barbados | 0.0 /100 | #326 | Tragic 13.5% |
| Immigrants | Dominican Republic | 0.0 /100 | #327 | Tragic 13.6% |
| British West Indians | 0.0 /100 | #328 | Tragic 13.7% |