Creek vs South African Unemployment Among Ages 20 to 24 years
COMPARE
Creek
South African
Unemployment Among Ages 20 to 24 years
Unemployment Among Ages 20 to 24 years Comparison
Creek
South Africans
9.7%
UNEMPLOYMENT AMONG AGES 20 TO 24 YEARS
99.8/ 100
METRIC RATING
49th/ 347
METRIC RANK
10.1%
UNEMPLOYMENT AMONG AGES 20 TO 24 YEARS
87.8/ 100
METRIC RATING
121st/ 347
METRIC RANK
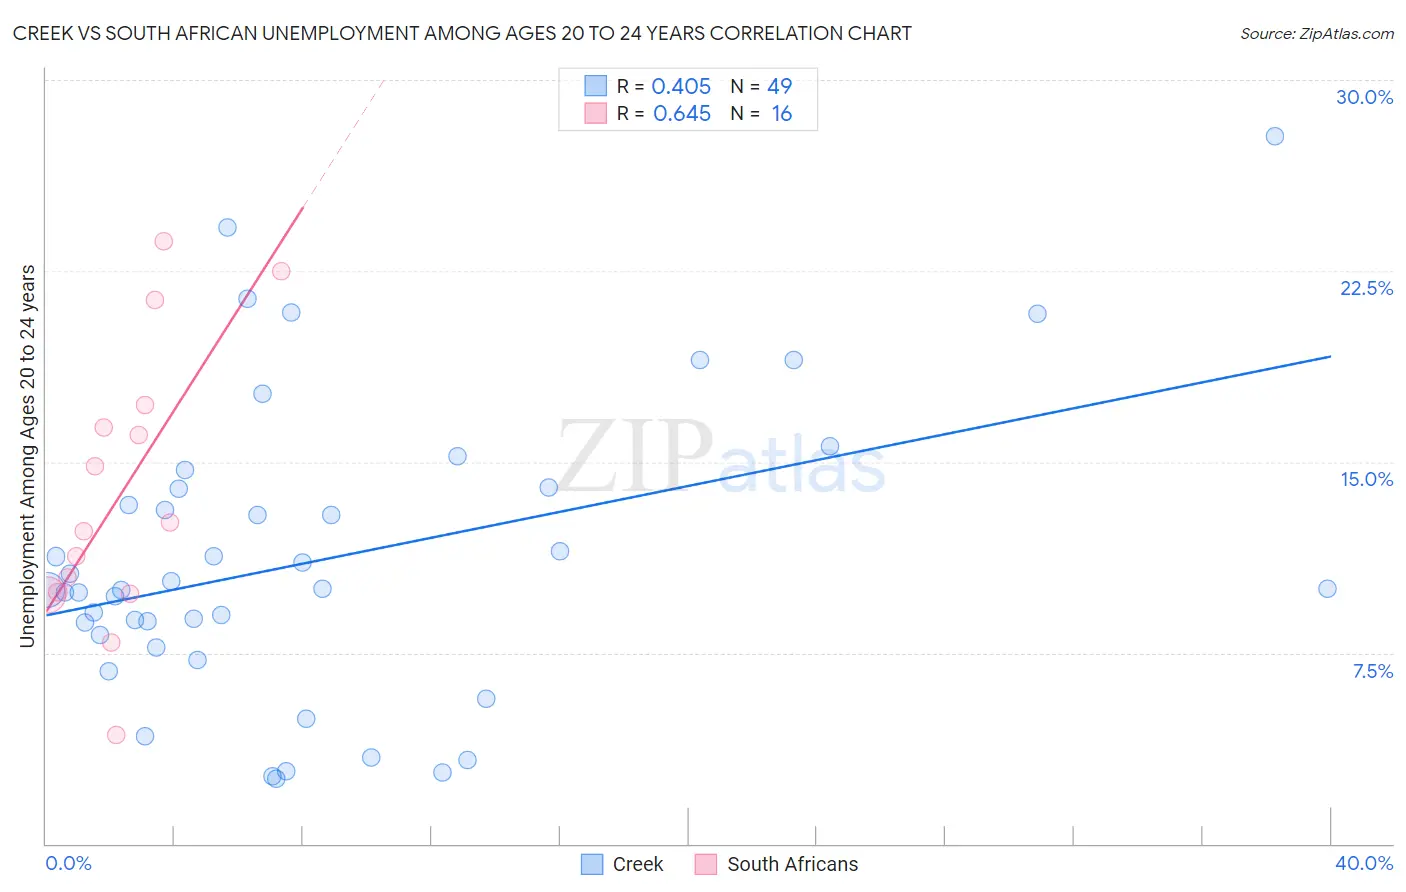
Creek vs South African Unemployment Among Ages 20 to 24 years Correlation Chart
The statistical analysis conducted on geographies consisting of 174,635,807 people shows a moderate positive correlation between the proportion of Creek and unemployment rate among population between the ages 20 and 24 in the United States with a correlation coefficient (R) of 0.405 and weighted average of 9.7%. Similarly, the statistical analysis conducted on geographies consisting of 179,868,071 people shows a significant positive correlation between the proportion of South Africans and unemployment rate among population between the ages 20 and 24 in the United States with a correlation coefficient (R) of 0.645 and weighted average of 10.1%, a difference of 4.0%.
Unemployment Among Ages 20 to 24 years Correlation Summary
| Measurement | Creek | South African |
| Minimum | 2.5% | 4.3% |
| Maximum | 27.8% | 23.7% |
| Range | 25.3% | 19.4% |
| Mean | 11.2% | 13.8% |
| Median | 10.0% | 12.4% |
| Interquartile 25% (IQ1) | 8.0% | 9.8% |
| Interquartile 75% (IQ3) | 14.0% | 16.8% |
| Interquartile Range (IQR) | 6.0% | 6.9% |
| Standard Deviation (Sample) | 5.8% | 5.5% |
| Standard Deviation (Population) | 5.7% | 5.3% |
Similar Demographics by Unemployment Among Ages 20 to 24 years
Demographics Similar to Creek by Unemployment Among Ages 20 to 24 years
In terms of unemployment among ages 20 to 24 years, the demographic groups most similar to Creek are Finnish (9.7%, a difference of 0.080%), Immigrants from India (9.7%, a difference of 0.090%), Immigrants from Kenya (9.7%, a difference of 0.14%), Immigrants from Nicaragua (9.7%, a difference of 0.21%), and Ethiopian (9.8%, a difference of 0.21%).
| Demographics | Rating | Rank | Unemployment Among Ages 20 to 24 years |
| Immigrants | Saudi Arabia | 99.9 /100 | #42 | Exceptional 9.7% |
| Menominee | 99.8 /100 | #43 | Exceptional 9.7% |
| Europeans | 99.8 /100 | #44 | Exceptional 9.7% |
| Croatians | 99.8 /100 | #45 | Exceptional 9.7% |
| Immigrants | Nicaragua | 99.8 /100 | #46 | Exceptional 9.7% |
| Immigrants | India | 99.8 /100 | #47 | Exceptional 9.7% |
| Finns | 99.8 /100 | #48 | Exceptional 9.7% |
| Creek | 99.8 /100 | #49 | Exceptional 9.7% |
| Immigrants | Kenya | 99.7 /100 | #50 | Exceptional 9.7% |
| Ethiopians | 99.7 /100 | #51 | Exceptional 9.8% |
| Immigrants | Thailand | 99.7 /100 | #52 | Exceptional 9.8% |
| Immigrants | Serbia | 99.6 /100 | #53 | Exceptional 9.8% |
| Immigrants | Cambodia | 99.6 /100 | #54 | Exceptional 9.8% |
| Carpatho Rusyns | 99.6 /100 | #55 | Exceptional 9.8% |
| Nicaraguans | 99.6 /100 | #56 | Exceptional 9.8% |
Demographics Similar to South Africans by Unemployment Among Ages 20 to 24 years
In terms of unemployment among ages 20 to 24 years, the demographic groups most similar to South Africans are Immigrants from Canada (10.1%, a difference of 0.030%), French (10.1%, a difference of 0.040%), White/Caucasian (10.1%, a difference of 0.040%), Immigrants from Iraq (10.1%, a difference of 0.060%), and Paraguayan (10.1%, a difference of 0.070%).
| Demographics | Rating | Rank | Unemployment Among Ages 20 to 24 years |
| Ottawa | 90.8 /100 | #114 | Exceptional 10.1% |
| Immigrants | Morocco | 90.5 /100 | #115 | Exceptional 10.1% |
| Basques | 89.8 /100 | #116 | Excellent 10.1% |
| Immigrants | Uruguay | 89.6 /100 | #117 | Excellent 10.1% |
| Paraguayans | 88.6 /100 | #118 | Excellent 10.1% |
| French | 88.2 /100 | #119 | Excellent 10.1% |
| Immigrants | Canada | 88.2 /100 | #120 | Excellent 10.1% |
| South Africans | 87.8 /100 | #121 | Excellent 10.1% |
| Whites/Caucasians | 87.4 /100 | #122 | Excellent 10.1% |
| Immigrants | Iraq | 87.1 /100 | #123 | Excellent 10.1% |
| Immigrants | Japan | 86.5 /100 | #124 | Excellent 10.1% |
| Spanish | 86.1 /100 | #125 | Excellent 10.1% |
| Jordanians | 86.1 /100 | #126 | Excellent 10.1% |
| Immigrants | Norway | 85.3 /100 | #127 | Excellent 10.1% |
| Immigrants | Brazil | 84.9 /100 | #128 | Excellent 10.1% |