Colville vs Bangladeshi Unemployment Among Ages 45 to 54 years
COMPARE
Colville
Bangladeshi
Unemployment Among Ages 45 to 54 years
Unemployment Among Ages 45 to 54 years Comparison
Colville
Bangladeshis
7.4%
UNEMPLOYMENT AMONG AGES 45 TO 54 YEARS
0.0/ 100
METRIC RATING
338th/ 347
METRIC RANK
4.5%
UNEMPLOYMENT AMONG AGES 45 TO 54 YEARS
59.7/ 100
METRIC RATING
163rd/ 347
METRIC RANK
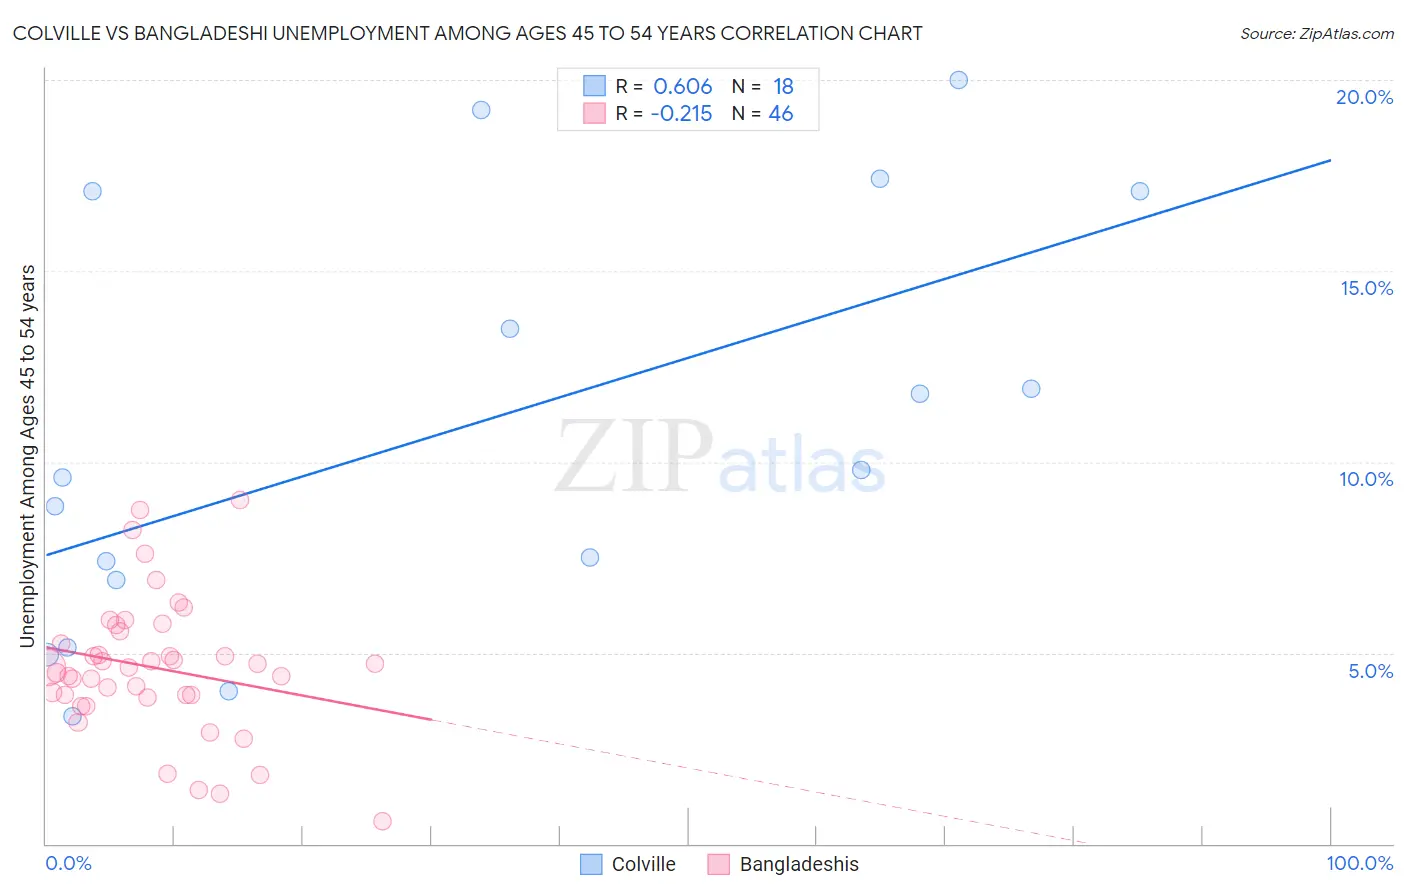
Colville vs Bangladeshi Unemployment Among Ages 45 to 54 years Correlation Chart
The statistical analysis conducted on geographies consisting of 34,483,294 people shows a significant positive correlation between the proportion of Colville and unemployment rate among population between the ages 45 and 54 in the United States with a correlation coefficient (R) of 0.606 and weighted average of 7.4%. Similarly, the statistical analysis conducted on geographies consisting of 139,604,321 people shows a weak negative correlation between the proportion of Bangladeshis and unemployment rate among population between the ages 45 and 54 in the United States with a correlation coefficient (R) of -0.215 and weighted average of 4.5%, a difference of 63.8%.
Unemployment Among Ages 45 to 54 years Correlation Summary
| Measurement | Colville | Bangladeshi |
| Minimum | 3.3% | 0.60% |
| Maximum | 20.0% | 9.0% |
| Range | 16.7% | 8.4% |
| Mean | 10.9% | 4.6% |
| Median | 9.7% | 4.6% |
| Interquartile 25% (IQ1) | 6.9% | 3.9% |
| Interquartile 75% (IQ3) | 17.1% | 5.6% |
| Interquartile Range (IQR) | 10.2% | 1.7% |
| Standard Deviation (Sample) | 5.4% | 1.8% |
| Standard Deviation (Population) | 5.3% | 1.8% |
Similar Demographics by Unemployment Among Ages 45 to 54 years
Demographics Similar to Colville by Unemployment Among Ages 45 to 54 years
In terms of unemployment among ages 45 to 54 years, the demographic groups most similar to Colville are Arapaho (7.5%, a difference of 1.5%), Hopi (7.5%, a difference of 1.9%), Apache (7.0%, a difference of 5.0%), Paiute (7.8%, a difference of 5.5%), and Puerto Rican (6.8%, a difference of 8.5%).
| Demographics | Rating | Rank | Unemployment Among Ages 45 to 54 years |
| Tohono O'odham | 0.0 /100 | #331 | Tragic 6.3% |
| Pima | 0.0 /100 | #332 | Tragic 6.4% |
| Immigrants | Yemen | 0.0 /100 | #333 | Tragic 6.5% |
| Sioux | 0.0 /100 | #334 | Tragic 6.6% |
| Navajo | 0.0 /100 | #335 | Tragic 6.7% |
| Puerto Ricans | 0.0 /100 | #336 | Tragic 6.8% |
| Apache | 0.0 /100 | #337 | Tragic 7.0% |
| Colville | 0.0 /100 | #338 | Tragic 7.4% |
| Arapaho | 0.0 /100 | #339 | Tragic 7.5% |
| Hopi | 0.0 /100 | #340 | Tragic 7.5% |
| Paiute | 0.0 /100 | #341 | Tragic 7.8% |
| Alaskan Athabascans | 0.0 /100 | #342 | Tragic 8.5% |
| Inupiat | 0.0 /100 | #343 | Tragic 9.2% |
| Yuman | 0.0 /100 | #344 | Tragic 9.5% |
| Cheyenne | 0.0 /100 | #345 | Tragic 10.6% |
Demographics Similar to Bangladeshis by Unemployment Among Ages 45 to 54 years
In terms of unemployment among ages 45 to 54 years, the demographic groups most similar to Bangladeshis are Immigrants from Indonesia (4.5%, a difference of 0.030%), Samoan (4.5%, a difference of 0.060%), Immigrants from Eastern Europe (4.5%, a difference of 0.090%), Maltese (4.5%, a difference of 0.090%), and Immigrants from South Eastern Asia (4.5%, a difference of 0.11%).
| Demographics | Rating | Rank | Unemployment Among Ages 45 to 54 years |
| Immigrants | Croatia | 69.6 /100 | #156 | Good 4.5% |
| Indians (Asian) | 68.1 /100 | #157 | Good 4.5% |
| Immigrants | Italy | 65.5 /100 | #158 | Good 4.5% |
| Immigrants | Nonimmigrants | 62.8 /100 | #159 | Good 4.5% |
| Immigrants | South Eastern Asia | 62.0 /100 | #160 | Good 4.5% |
| Immigrants | Eastern Europe | 61.6 /100 | #161 | Good 4.5% |
| Immigrants | Indonesia | 60.3 /100 | #162 | Good 4.5% |
| Bangladeshis | 59.7 /100 | #163 | Average 4.5% |
| Samoans | 58.5 /100 | #164 | Average 4.5% |
| Maltese | 57.9 /100 | #165 | Average 4.5% |
| Immigrants | Western Europe | 57.4 /100 | #166 | Average 4.5% |
| Immigrants | Brazil | 56.4 /100 | #167 | Average 4.5% |
| Immigrants | Europe | 54.7 /100 | #168 | Average 4.5% |
| Immigrants | Egypt | 54.7 /100 | #169 | Average 4.5% |
| Spaniards | 54.3 /100 | #170 | Average 4.5% |