Colville vs Yuman Unemployment Among Ages 45 to 54 years
COMPARE
Colville
Yuman
Unemployment Among Ages 45 to 54 years
Unemployment Among Ages 45 to 54 years Comparison
Colville
Yuman
7.4%
UNEMPLOYMENT AMONG AGES 45 TO 54 YEARS
0.0/ 100
METRIC RATING
338th/ 347
METRIC RANK
9.5%
UNEMPLOYMENT AMONG AGES 45 TO 54 YEARS
0.0/ 100
METRIC RATING
344th/ 347
METRIC RANK
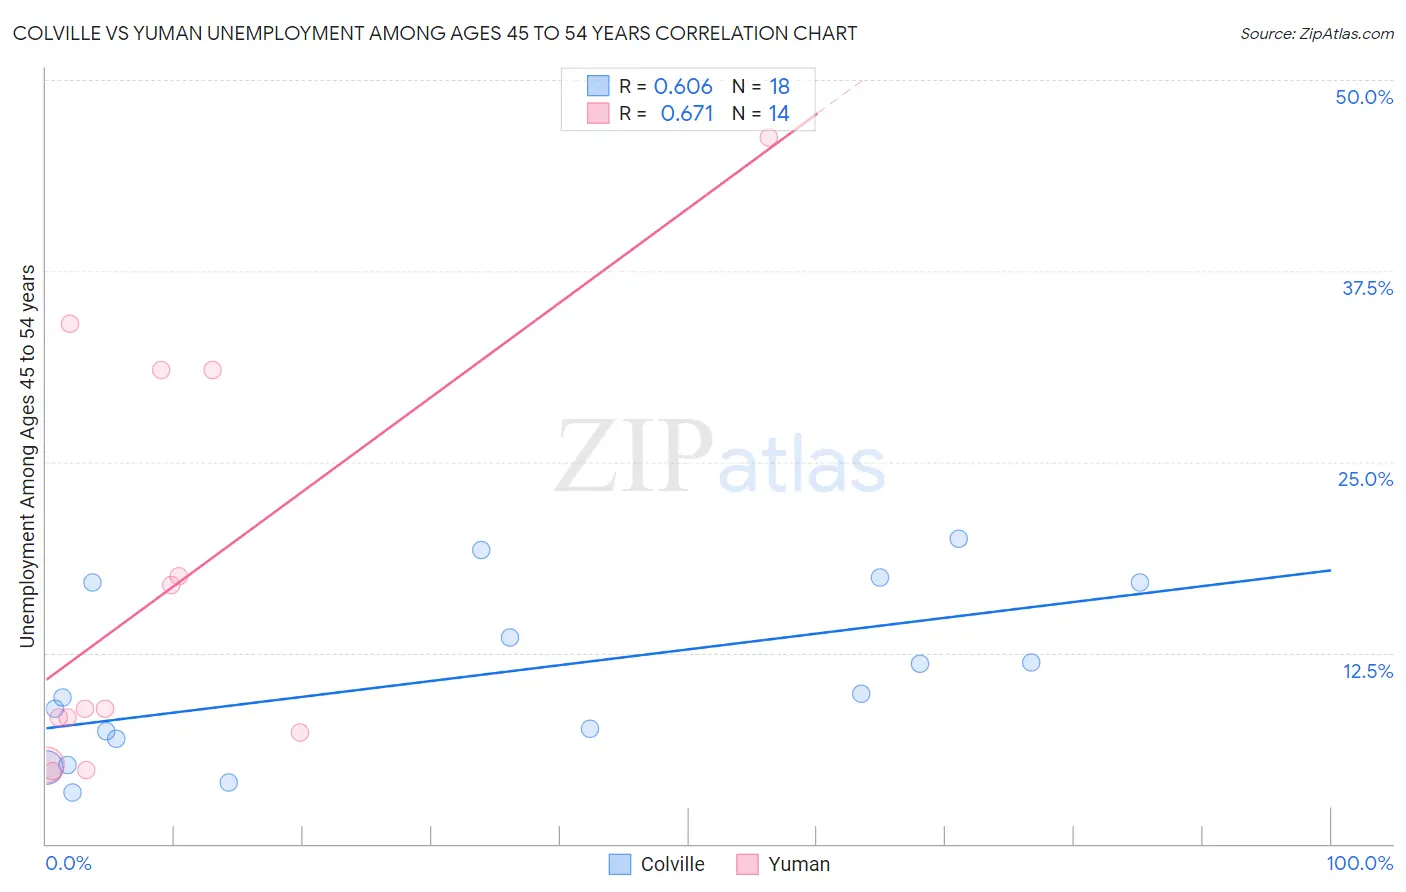
Colville vs Yuman Unemployment Among Ages 45 to 54 years Correlation Chart
The statistical analysis conducted on geographies consisting of 34,483,294 people shows a significant positive correlation between the proportion of Colville and unemployment rate among population between the ages 45 and 54 in the United States with a correlation coefficient (R) of 0.606 and weighted average of 7.4%. Similarly, the statistical analysis conducted on geographies consisting of 40,470,848 people shows a significant positive correlation between the proportion of Yuman and unemployment rate among population between the ages 45 and 54 in the United States with a correlation coefficient (R) of 0.671 and weighted average of 9.5%, a difference of 28.7%.
Unemployment Among Ages 45 to 54 years Correlation Summary
| Measurement | Colville | Yuman |
| Minimum | 3.3% | 4.8% |
| Maximum | 20.0% | 46.2% |
| Range | 16.7% | 41.4% |
| Mean | 10.9% | 16.6% |
| Median | 9.7% | 8.8% |
| Interquartile 25% (IQ1) | 6.9% | 7.3% |
| Interquartile 75% (IQ3) | 17.1% | 31.0% |
| Interquartile Range (IQR) | 10.2% | 23.7% |
| Standard Deviation (Sample) | 5.4% | 13.4% |
| Standard Deviation (Population) | 5.3% | 13.0% |
Demographics Similar to Colville and Yuman by Unemployment Among Ages 45 to 54 years
In terms of unemployment among ages 45 to 54 years, the demographic groups most similar to Colville are Arapaho (7.5%, a difference of 1.5%), Hopi (7.5%, a difference of 1.9%), Apache (7.0%, a difference of 5.0%), Paiute (7.8%, a difference of 5.5%), and Puerto Rican (6.8%, a difference of 8.5%). Similarly, the demographic groups most similar to Yuman are Inupiat (9.2%, a difference of 3.3%), Cheyenne (10.6%, a difference of 11.3%), Alaskan Athabascan (8.5%, a difference of 12.2%), Paiute (7.8%, a difference of 22.0%), and Yup'ik (11.9%, a difference of 25.2%).
| Demographics | Rating | Rank | Unemployment Among Ages 45 to 54 years |
| Pueblo | 0.0 /100 | #328 | Tragic 6.2% |
| Alaska Natives | 0.0 /100 | #329 | Tragic 6.3% |
| Immigrants | Dominican Republic | 0.0 /100 | #330 | Tragic 6.3% |
| Tohono O'odham | 0.0 /100 | #331 | Tragic 6.3% |
| Pima | 0.0 /100 | #332 | Tragic 6.4% |
| Immigrants | Yemen | 0.0 /100 | #333 | Tragic 6.5% |
| Sioux | 0.0 /100 | #334 | Tragic 6.6% |
| Navajo | 0.0 /100 | #335 | Tragic 6.7% |
| Puerto Ricans | 0.0 /100 | #336 | Tragic 6.8% |
| Apache | 0.0 /100 | #337 | Tragic 7.0% |
| Colville | 0.0 /100 | #338 | Tragic 7.4% |
| Arapaho | 0.0 /100 | #339 | Tragic 7.5% |
| Hopi | 0.0 /100 | #340 | Tragic 7.5% |
| Paiute | 0.0 /100 | #341 | Tragic 7.8% |
| Alaskan Athabascans | 0.0 /100 | #342 | Tragic 8.5% |
| Inupiat | 0.0 /100 | #343 | Tragic 9.2% |
| Yuman | 0.0 /100 | #344 | Tragic 9.5% |
| Cheyenne | 0.0 /100 | #345 | Tragic 10.6% |
| Yup'ik | 0.0 /100 | #346 | Tragic 11.9% |
| Crow | 0.0 /100 | #347 | Tragic 13.7% |