Immigrants vs Salvadoran Unemployment Among Ages 45 to 54 years
COMPARE
Immigrants
Salvadoran
Unemployment Among Ages 45 to 54 years
Unemployment Among Ages 45 to 54 years Comparison
Immigrants
Salvadorans
4.7%
UNEMPLOYMENT AMONG AGES 45 TO 54 YEARS
2.6/ 100
METRIC RATING
233rd/ 347
METRIC RANK
4.8%
UNEMPLOYMENT AMONG AGES 45 TO 54 YEARS
0.7/ 100
METRIC RATING
250th/ 347
METRIC RANK
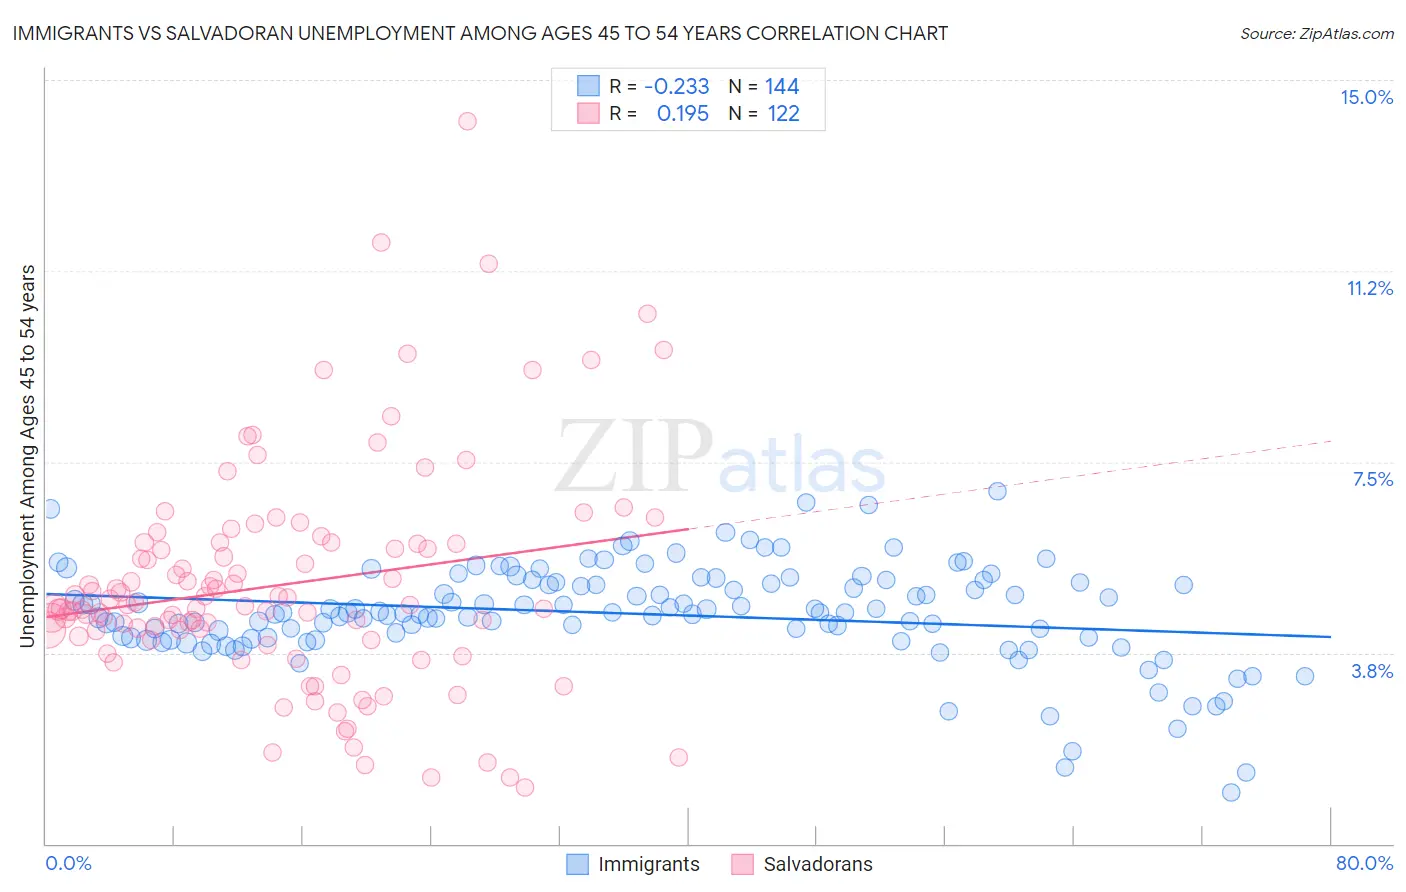
Immigrants vs Salvadoran Unemployment Among Ages 45 to 54 years Correlation Chart
The statistical analysis conducted on geographies consisting of 533,580,848 people shows a weak negative correlation between the proportion of Immigrants and unemployment rate among population between the ages 45 and 54 in the United States with a correlation coefficient (R) of -0.233 and weighted average of 4.7%. Similarly, the statistical analysis conducted on geographies consisting of 389,473,672 people shows a poor positive correlation between the proportion of Salvadorans and unemployment rate among population between the ages 45 and 54 in the United States with a correlation coefficient (R) of 0.195 and weighted average of 4.8%, a difference of 1.6%.
Unemployment Among Ages 45 to 54 years Correlation Summary
| Measurement | Immigrants | Salvadoran |
| Minimum | 1.0% | 1.1% |
| Maximum | 6.9% | 14.2% |
| Range | 5.9% | 13.1% |
| Mean | 4.5% | 5.1% |
| Median | 4.5% | 4.7% |
| Interquartile 25% (IQ1) | 4.0% | 4.1% |
| Interquartile 75% (IQ3) | 5.1% | 5.9% |
| Interquartile Range (IQR) | 1.1% | 1.8% |
| Standard Deviation (Sample) | 0.98% | 2.2% |
| Standard Deviation (Population) | 0.97% | 2.2% |
Demographics Similar to Immigrants and Salvadorans by Unemployment Among Ages 45 to 54 years
In terms of unemployment among ages 45 to 54 years, the demographic groups most similar to Immigrants are Soviet Union (4.7%, a difference of 0.020%), Immigrants from Ireland (4.7%, a difference of 0.040%), Ottawa (4.7%, a difference of 0.040%), Cree (4.7%, a difference of 0.17%), and Tlingit-Haida (4.7%, a difference of 0.18%). Similarly, the demographic groups most similar to Salvadorans are Immigrants from Honduras (4.8%, a difference of 0.070%), Immigrants from Liberia (4.8%, a difference of 0.24%), Israeli (4.8%, a difference of 0.35%), Immigrants from Syria (4.8%, a difference of 0.40%), and Immigrants from Albania (4.8%, a difference of 0.41%).
| Demographics | Rating | Rank | Unemployment Among Ages 45 to 54 years |
| Immigrants | Ireland | 2.7 /100 | #231 | Tragic 4.7% |
| Ottawa | 2.7 /100 | #232 | Tragic 4.7% |
| Immigrants | Immigrants | 2.6 /100 | #233 | Tragic 4.7% |
| Soviet Union | 2.6 /100 | #234 | Tragic 4.7% |
| Cree | 2.3 /100 | #235 | Tragic 4.7% |
| Tlingit-Haida | 2.3 /100 | #236 | Tragic 4.7% |
| Alsatians | 1.6 /100 | #237 | Tragic 4.7% |
| Yaqui | 1.4 /100 | #238 | Tragic 4.7% |
| Spanish Americans | 1.4 /100 | #239 | Tragic 4.7% |
| Immigrants | Iraq | 1.3 /100 | #240 | Tragic 4.7% |
| Delaware | 1.3 /100 | #241 | Tragic 4.8% |
| Central Americans | 1.3 /100 | #242 | Tragic 4.8% |
| Portuguese | 1.1 /100 | #243 | Tragic 4.8% |
| Seminole | 1.1 /100 | #244 | Tragic 4.8% |
| Immigrants | Albania | 0.9 /100 | #245 | Tragic 4.8% |
| Immigrants | Syria | 0.9 /100 | #246 | Tragic 4.8% |
| Israelis | 0.9 /100 | #247 | Tragic 4.8% |
| Immigrants | Liberia | 0.8 /100 | #248 | Tragic 4.8% |
| Immigrants | Honduras | 0.7 /100 | #249 | Tragic 4.8% |
| Salvadorans | 0.7 /100 | #250 | Tragic 4.8% |
| Hondurans | 0.4 /100 | #251 | Tragic 4.8% |