Carpatho Rusyn vs Senegalese Unemployment Among Women with Children Ages 6 to 17 years

COMPARE

Carpatho Rusyn
Race
Ancestry
AfghanAfricanAlaska NativeAlaskan AthabascanAlbanianAleutAlsatianAmericanApacheArabArapahoArgentineanArmenianAssyrian/Chaldean/SyriacAustralianAustrianBahamianBangladeshiBarbadianBasqueBelgianBelizeanBermudanBhutaneseBlackfeetBolivianBrazilianBritishBritish West IndianBulgarianBurmeseCajunCambodianCanadianCape VerdeanCarpatho RusynCelticCentral AmericanCentral American IndianCherokeeCheyenneChickasawChileanChineseChippewaChoctawColombianColvilleComancheCosta RicanCreeCreekCroatianCrowCubanCypriotCzechCzechoslovakianDanishDelawareDominicanDutchDutch West IndianEastern EuropeanEcuadorianEgyptianEnglishEstonianEthiopianEuropeanFijianFilipinoFinnishFrenchFrench American IndianFrench CanadianGermanGerman RussianGhanaianGreekGuamanian/ChamorroGuatemalanGuyaneseHaitianHmongHonduranHopiHoumaHungarianIcelanderIndian (Asian)IndonesianInupiatIranianIraqiIrishIroquoisIsraeliItalianJamaicanJapaneseJordanianKenyanKiowaKoreanLaotianLatvianLebaneseLiberianLithuanianLumbeeLuxembourgerMacedonianMalaysianMalteseMarshalleseMenomineeMexicanMexican American IndianMongolianMoroccanNative HawaiianNavajoNepaleseNew ZealanderNicaraguanNigerianNorthern EuropeanNorwegianOkinawanOsageOttawaPaiutePakistaniPalestinianPanamanianParaguayanPennsylvania GermanPeruvianPimaPolishPortuguesePotawatomiPuebloPuerto RicanPuget Sound SalishRomanianRussianSalvadoranSamoanScandinavianScotch-IrishScottishSeminoleSerbianShoshoneSierra LeoneanSiouxSlavicSlovakSloveneSomaliSouth AfricanSouth AmericanSouth American IndianSoviet UnionSpaniardSpanishSpanish AmericanSpanish American IndianSri LankanSubsaharan AfricanSudaneseSwedishSwissSyrianTaiwaneseThaiTlingit-HaidaTohono O'OdhamTonganTrinidadian and TobagonianTsimshianTurkishU.S. Virgin IslanderUgandanUkrainianUruguayanUteVenezuelanVietnameseWelshWest IndianYakamaYaquiYugoslavianYumanYup'ikZimbabwean
Immigration
NonimmigrantsImmigrantsAfghanistanAfricaAlbaniaArgentinaArmeniaAsiaAustraliaAustriaBahamasBangladeshBarbadosBelarusBelgiumBelizeBoliviaBosnia and HerzegovinaBrazilBulgariaBurma/MyanmarCabo VerdeCambodiaCameroonCanadaCaribbeanCentral AmericaChileChinaColombiaCongoCosta RicaCroatiaCubaCzechoslovakiaDenmarkDominicaDominican RepublicEastern AfricaEastern AsiaEastern EuropeEcuadorEgyptEl SalvadorEnglandEritreaEthiopiaEuropeFijiFranceGermanyGhanaGreeceGrenadaGuatemalaGuyanaHaitiHondurasHong KongHungaryIndiaIndonesiaIranIraqIrelandIsraelItalyJamaicaJapanJordanKazakhstanKenyaKoreaKuwaitLaosLatin AmericaLatviaLebanonLiberiaLithuaniaMalaysiaMexicoMicronesiaMiddle AfricaMoldovaMoroccoNepalNetherlandsNicaraguaNigeriaNorth AmericaNorth MacedoniaNorthern AfricaNorthern EuropeNorwayOceaniaPakistanPanamaPeruPhilippinesPolandPortugalRomaniaRussiaSaudi ArabiaScotlandSenegalSerbiaSierra LeoneSingaporeSomaliaSouth AfricaSouth AmericaSouth Central AsiaSouth Eastern AsiaSouthern EuropeSpainSri LankaSt. Vincent and the GrenadinesSudanSwedenSwitzerlandSyriaTaiwanThailandTrinidad and TobagoTurkeyUgandaUkraineUruguayUzbekistanVenezuelaVietnamWest IndiesWestern AfricaWestern AsiaWestern EuropeYemenZaireZimbabweAzores
Senegalese
Race
Ancestry
AfghanAfricanAlaska NativeAlaskan AthabascanAlbanianAleutAlsatianAmericanApacheArabArapahoArgentineanArmenianAssyrian/Chaldean/SyriacAustralianAustrianBahamianBangladeshiBarbadianBasqueBelgianBelizeanBermudanBhutaneseBlackfeetBolivianBrazilianBritishBritish West IndianBulgarianBurmeseCajunCambodianCanadianCape VerdeanCelticCentral AmericanCentral American IndianCherokeeCheyenneChickasawChileanChineseChippewaChoctawColombianColvilleComancheCosta RicanCreeCreekCroatianCrowCubanCypriotCzechCzechoslovakianDanishDelawareDominicanDutchDutch West IndianEastern EuropeanEcuadorianEgyptianEnglishEstonianEthiopianEuropeanFijianFilipinoFinnishFrenchFrench American IndianFrench CanadianGermanGerman RussianGhanaianGreekGuamanian/ChamorroGuatemalanGuyaneseHaitianHmongHonduranHopiHoumaHungarianIcelanderIndian (Asian)IndonesianInupiatIranianIraqiIrishIroquoisIsraeliItalianJamaicanJapaneseJordanianKenyanKiowaKoreanLaotianLatvianLebaneseLiberianLithuanianLumbeeLuxembourgerMacedonianMalaysianMalteseMarshalleseMenomineeMexicanMexican American IndianMongolianMoroccanNative HawaiianNavajoNepaleseNew ZealanderNicaraguanNigerianNorthern EuropeanNorwegianOkinawanOsageOttawaPaiutePakistaniPalestinianPanamanianParaguayanPennsylvania GermanPeruvianPimaPolishPortuguesePotawatomiPuebloPuerto RicanPuget Sound SalishRomanianRussianSalvadoranSamoanScandinavianScotch-IrishScottishSeminoleSenegaleseSerbianShoshoneSierra LeoneanSiouxSlavicSlovakSloveneSomaliSouth AfricanSouth AmericanSouth American IndianSoviet UnionSpaniardSpanishSpanish AmericanSpanish American IndianSri LankanSubsaharan AfricanSudaneseSwedishSwissSyrianTaiwaneseThaiTlingit-HaidaTohono O'OdhamTonganTrinidadian and TobagonianTsimshianTurkishU.S. Virgin IslanderUgandanUkrainianUruguayanUteVenezuelanVietnameseWelshWest IndianYakamaYaquiYugoslavianYumanYup'ikZimbabwean
Immigration
NonimmigrantsImmigrantsAfghanistanAfricaAlbaniaArgentinaArmeniaAsiaAustraliaAustriaBahamasBangladeshBarbadosBelarusBelgiumBelizeBoliviaBosnia and HerzegovinaBrazilBulgariaBurma/MyanmarCabo VerdeCambodiaCameroonCanadaCaribbeanCentral AmericaChileChinaColombiaCongoCosta RicaCroatiaCubaCzechoslovakiaDenmarkDominicaDominican RepublicEastern AfricaEastern AsiaEastern EuropeEcuadorEgyptEl SalvadorEnglandEritreaEthiopiaEuropeFijiFranceGermanyGhanaGreeceGrenadaGuatemalaGuyanaHaitiHondurasHong KongHungaryIndiaIndonesiaIranIraqIrelandIsraelItalyJamaicaJapanJordanKazakhstanKenyaKoreaKuwaitLaosLatin AmericaLatviaLebanonLiberiaLithuaniaMalaysiaMexicoMicronesiaMiddle AfricaMoldovaMoroccoNepalNetherlandsNicaraguaNigeriaNorth AmericaNorth MacedoniaNorthern AfricaNorthern EuropeNorwayOceaniaPakistanPanamaPeruPhilippinesPolandPortugalRomaniaRussiaSaudi ArabiaScotlandSenegalSerbiaSierra LeoneSingaporeSomaliaSouth AfricaSouth AmericaSouth Central AsiaSouth Eastern AsiaSouthern EuropeSpainSri LankaSt. Vincent and the GrenadinesSudanSwedenSwitzerlandSyriaTaiwanThailandTrinidad and TobagoTurkeyUgandaUkraineUruguayUzbekistanVenezuelaVietnamWest IndiesWestern AfricaWestern AsiaWestern EuropeYemenZaireZimbabweAzores
Unemployment Among Women with Children Ages 6 to 17 years
Income
Poverty
Unemployment
Labor Participation
Family Structure
Vehicle Availability
Education Level
Disability

Unemployment Among Women with Children Ages 6 to 17 years Comparison

Carpatho Rusyns

Senegalese

Tragic
Tragic
10.0%
UNEMPLOYMENT AMONG WOMEN WITH CHILDREN AGES 6 TO 17 YEARS
0.0/ 100
METRIC RATING
292nd/ 347
METRIC RANK
9.5%
UNEMPLOYMENT AMONG WOMEN WITH CHILDREN AGES 6 TO 17 YEARS
0.5/ 100
METRIC RATING
262nd/ 347
METRIC RANK

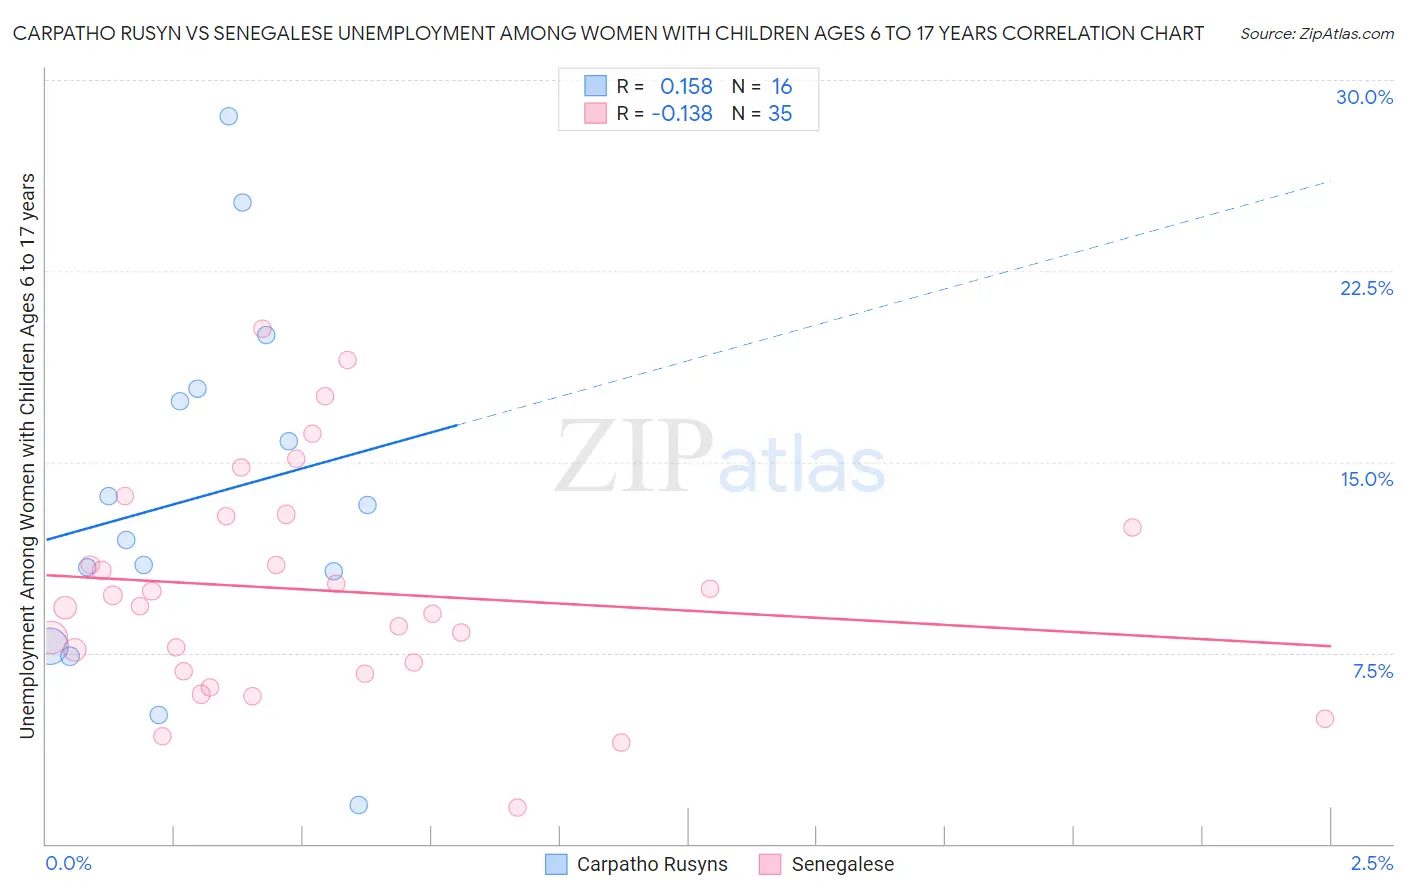
Carpatho Rusyn vs Senegalese Unemployment Among Women with Children Ages 6 to 17 years Correlation Chart

The statistical analysis conducted on geographies consisting of 51,221,084 people shows a poor positive correlation between the proportion of Carpatho Rusyns and unemployment rate among women with children between the ages 6 and 17 in the United States with a correlation coefficient (R) of 0.158 and weighted average of 10.0%. Similarly, the statistical analysis conducted on geographies consisting of 70,256,082 people shows a poor negative correlation between the proportion of Senegalese and unemployment rate among women with children between the ages 6 and 17 in the United States with a correlation coefficient (R) of -0.138 and weighted average of 9.5%, a difference of 5.4%.
Carpatho Rusyn vs Senegalese Unemployment Among Women with Children Ages 6 to 17 years

Unemployment Among Women with Children Ages 6 to 17 years Correlation Summary

MeasurementCarpatho RusynSenegalese
Minimum1.5%1.4%
Maximum28.6%20.2%
Range27.1%18.8%
Mean13.6%9.9%
Median12.6%9.3%
Interquartile 25% (IQ1)9.2%6.8%
Interquartile 75% (IQ3)17.6%12.9%
Interquartile Range (IQR)8.4%6.1%
Standard Deviation (Sample)7.1%4.3%
Standard Deviation (Population)6.9%4.3%

Similar Demographics by Unemployment Among Women with Children Ages 6 to 17 years

Demographics Similar to Carpatho Rusyns by Unemployment Among Women with Children Ages 6 to 17 years

In terms of unemployment among women with children ages 6 to 17 years, the demographic groups most similar to Carpatho Rusyns are Nonimmigrants (10.0%, a difference of 0.010%), Subsaharan African (10.0%, a difference of 0.030%), Honduran (10.0%, a difference of 0.050%), Haitian (10.0%, a difference of 0.090%), and Ecuadorian (10.0%, a difference of 0.18%).
DemographicsRating | RankUnemployment Among Women with Children Ages 6 to 17 years
Hispanics or Latinos
0.0
/100
|
#285
Tragic
9.9%
Choctaw
0.0
/100
|
#286
Tragic
9.9%
Sierra Leoneans
0.0
/100
|
#287
Tragic
9.9%
Shoshone
0.0
/100
|
#288
Tragic
10.0%
Hondurans
0.0
/100
|
#289
Tragic
10.0%
Sub-Saharan Africans
0.0
/100
|
#290
Tragic
10.0%
Immigrants | Nonimmigrants
0.0
/100
|
#291
Tragic
10.0%
Carpatho Rusyns
0.0
/100
|
#292
Tragic
10.0%
Haitians
0.0
/100
|
#293
Tragic
10.0%
Ecuadorians
0.0
/100
|
#294
Tragic
10.0%
Cherokee
0.0
/100
|
#295
Tragic
10.0%
Immigrants | Western Africa
0.0
/100
|
#296
Tragic
10.1%
Immigrants | Caribbean
0.0
/100
|
#297
Tragic
10.1%
Immigrants | Haiti
0.0
/100
|
#298
Tragic
10.1%
Immigrants | Honduras
0.0
/100
|
#299
Tragic
10.1%

Demographics Similar to Senegalese by Unemployment Among Women with Children Ages 6 to 17 years

In terms of unemployment among women with children ages 6 to 17 years, the demographic groups most similar to Senegalese are Lebanese (9.5%, a difference of 0.040%), South American (9.5%, a difference of 0.050%), Italian (9.5%, a difference of 0.14%), Immigrants from Central America (9.5%, a difference of 0.25%), and Immigrants from Ghana (9.5%, a difference of 0.28%).
DemographicsRating | RankUnemployment Among Women with Children Ages 6 to 17 years
Lithuanians
0.9
/100
|
#255
Tragic
9.4%
Canadians
0.8
/100
|
#256
Tragic
9.4%
Celtics
0.7
/100
|
#257
Tragic
9.5%
Immigrants | Mexico
0.7
/100
|
#258
Tragic
9.5%
Immigrants | Central America
0.6
/100
|
#259
Tragic
9.5%
Italians
0.6
/100
|
#260
Tragic
9.5%
South Americans
0.5
/100
|
#261
Tragic
9.5%
Senegalese
0.5
/100
|
#262
Tragic
9.5%
Lebanese
0.5
/100
|
#263
Tragic
9.5%
Immigrants | Ghana
0.4
/100
|
#264
Tragic
9.5%
West Indians
0.4
/100
|
#265
Tragic
9.5%
Immigrants | Jamaica
0.3
/100
|
#266
Tragic
9.5%
Irish
0.3
/100
|
#267
Tragic
9.5%
Ghanaians
0.2
/100
|
#268
Tragic
9.6%
Blackfeet
0.2
/100
|
#269
Tragic
9.6%