Choctaw vs Immigrants from Portugal Unemployment Among Ages 25 to 29 years
COMPARE
Choctaw
Immigrants from Portugal
Unemployment Among Ages 25 to 29 years
Unemployment Among Ages 25 to 29 years Comparison
Choctaw
Immigrants from Portugal
7.5%
UNEMPLOYMENT AMONG AGES 25 TO 29 YEARS
0.0/ 100
METRIC RATING
271st/ 347
METRIC RANK
7.2%
UNEMPLOYMENT AMONG AGES 25 TO 29 YEARS
0.3/ 100
METRIC RATING
253rd/ 347
METRIC RANK
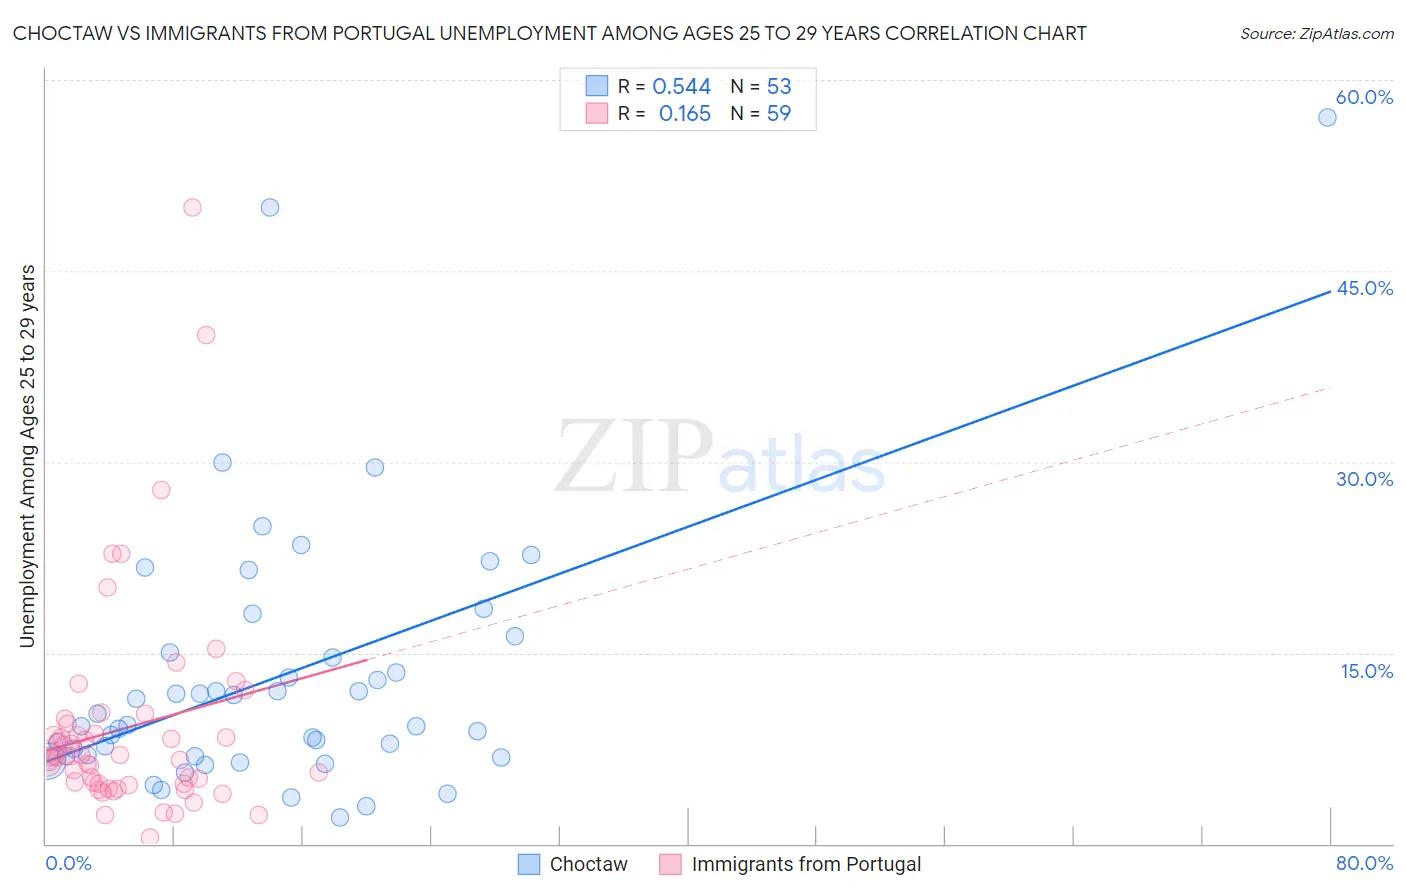
Choctaw vs Immigrants from Portugal Unemployment Among Ages 25 to 29 years Correlation Chart
The statistical analysis conducted on geographies consisting of 259,814,267 people shows a substantial positive correlation between the proportion of Choctaw and unemployment rate among population between the ages 25 and 29 in the United States with a correlation coefficient (R) of 0.544 and weighted average of 7.5%. Similarly, the statistical analysis conducted on geographies consisting of 169,562,653 people shows a poor positive correlation between the proportion of Immigrants from Portugal and unemployment rate among population between the ages 25 and 29 in the United States with a correlation coefficient (R) of 0.165 and weighted average of 7.2%, a difference of 3.1%.
Unemployment Among Ages 25 to 29 years Correlation Summary
| Measurement | Choctaw | Immigrants from Portugal |
| Minimum | 2.1% | 0.50% |
| Maximum | 57.1% | 50.0% |
| Range | 55.0% | 49.5% |
| Mean | 13.2% | 9.1% |
| Median | 9.3% | 6.8% |
| Interquartile 25% (IQ1) | 6.9% | 4.7% |
| Interquartile 75% (IQ3) | 15.7% | 9.4% |
| Interquartile Range (IQR) | 8.8% | 4.7% |
| Standard Deviation (Sample) | 10.5% | 8.6% |
| Standard Deviation (Population) | 10.4% | 8.5% |
Demographics Similar to Choctaw and Immigrants from Portugal by Unemployment Among Ages 25 to 29 years
In terms of unemployment among ages 25 to 29 years, the demographic groups most similar to Choctaw are Bahamian (7.5%, a difference of 0.020%), Immigrants from Bahamas (7.5%, a difference of 0.060%), Immigrants from Latin America (7.4%, a difference of 0.53%), Immigrants from Ecuador (7.4%, a difference of 0.59%), and Pennsylvania German (7.4%, a difference of 0.61%). Similarly, the demographic groups most similar to Immigrants from Portugal are Ghanaian (7.2%, a difference of 0.15%), Immigrants from Cameroon (7.2%, a difference of 0.21%), Sierra Leonean (7.2%, a difference of 0.32%), Mexican American Indian (7.3%, a difference of 0.40%), and Assyrian/Chaldean/Syriac (7.3%, a difference of 0.78%).
| Demographics | Rating | Rank | Unemployment Among Ages 25 to 29 years |
| Sierra Leoneans | 0.4 /100 | #252 | Tragic 7.2% |
| Immigrants | Portugal | 0.3 /100 | #253 | Tragic 7.2% |
| Ghanaians | 0.3 /100 | #254 | Tragic 7.2% |
| Immigrants | Cameroon | 0.3 /100 | #255 | Tragic 7.2% |
| Mexican American Indians | 0.3 /100 | #256 | Tragic 7.3% |
| Assyrians/Chaldeans/Syriacs | 0.2 /100 | #257 | Tragic 7.3% |
| Ottawa | 0.1 /100 | #258 | Tragic 7.3% |
| Cree | 0.1 /100 | #259 | Tragic 7.3% |
| Americans | 0.1 /100 | #260 | Tragic 7.4% |
| Nigerians | 0.1 /100 | #261 | Tragic 7.4% |
| Ecuadorians | 0.1 /100 | #262 | Tragic 7.4% |
| Kiowa | 0.1 /100 | #263 | Tragic 7.4% |
| Immigrants | Western Africa | 0.1 /100 | #264 | Tragic 7.4% |
| Immigrants | Fiji | 0.1 /100 | #265 | Tragic 7.4% |
| Paiute | 0.1 /100 | #266 | Tragic 7.4% |
| Pennsylvania Germans | 0.1 /100 | #267 | Tragic 7.4% |
| Immigrants | Ecuador | 0.1 /100 | #268 | Tragic 7.4% |
| Immigrants | Latin America | 0.1 /100 | #269 | Tragic 7.4% |
| Bahamians | 0.0 /100 | #270 | Tragic 7.5% |
| Choctaw | 0.0 /100 | #271 | Tragic 7.5% |
| Immigrants | Bahamas | 0.0 /100 | #272 | Tragic 7.5% |