Choctaw vs Immigrants from Kenya Unemployment Among Ages 25 to 29 years
COMPARE
Choctaw
Immigrants from Kenya
Unemployment Among Ages 25 to 29 years
Unemployment Among Ages 25 to 29 years Comparison
Choctaw
Immigrants from Kenya
7.5%
UNEMPLOYMENT AMONG AGES 25 TO 29 YEARS
0.0/ 100
METRIC RATING
271st/ 347
METRIC RANK
6.1%
UNEMPLOYMENT AMONG AGES 25 TO 29 YEARS
99.3/ 100
METRIC RATING
40th/ 347
METRIC RANK
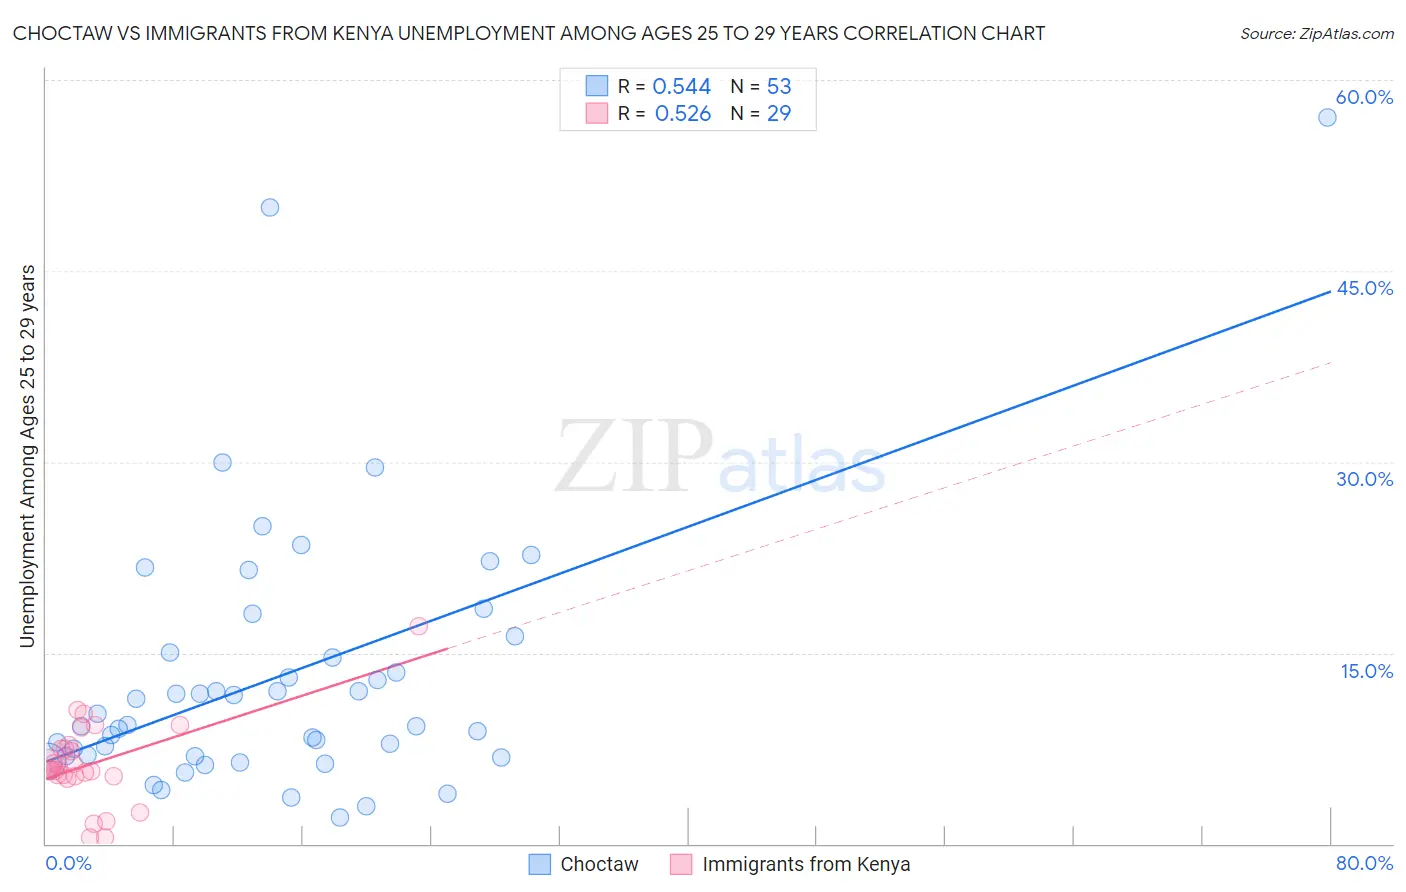
Choctaw vs Immigrants from Kenya Unemployment Among Ages 25 to 29 years Correlation Chart
The statistical analysis conducted on geographies consisting of 259,814,267 people shows a substantial positive correlation between the proportion of Choctaw and unemployment rate among population between the ages 25 and 29 in the United States with a correlation coefficient (R) of 0.544 and weighted average of 7.5%. Similarly, the statistical analysis conducted on geographies consisting of 213,451,821 people shows a substantial positive correlation between the proportion of Immigrants from Kenya and unemployment rate among population between the ages 25 and 29 in the United States with a correlation coefficient (R) of 0.526 and weighted average of 6.1%, a difference of 21.4%.
Unemployment Among Ages 25 to 29 years Correlation Summary
| Measurement | Choctaw | Immigrants from Kenya |
| Minimum | 2.1% | 0.50% |
| Maximum | 57.1% | 17.1% |
| Range | 55.0% | 16.6% |
| Mean | 13.2% | 6.3% |
| Median | 9.3% | 5.8% |
| Interquartile 25% (IQ1) | 6.9% | 5.3% |
| Interquartile 75% (IQ3) | 15.7% | 7.6% |
| Interquartile Range (IQR) | 8.8% | 2.3% |
| Standard Deviation (Sample) | 10.5% | 3.3% |
| Standard Deviation (Population) | 10.4% | 3.3% |
Similar Demographics by Unemployment Among Ages 25 to 29 years
Demographics Similar to Choctaw by Unemployment Among Ages 25 to 29 years
In terms of unemployment among ages 25 to 29 years, the demographic groups most similar to Choctaw are Bahamian (7.5%, a difference of 0.020%), Immigrants from Bahamas (7.5%, a difference of 0.060%), Immigrants from Nigeria (7.5%, a difference of 0.080%), Immigrants from Central America (7.5%, a difference of 0.29%), and Immigrants from Ghana (7.5%, a difference of 0.37%).
| Demographics | Rating | Rank | Unemployment Among Ages 25 to 29 years |
| Immigrants | Western Africa | 0.1 /100 | #264 | Tragic 7.4% |
| Immigrants | Fiji | 0.1 /100 | #265 | Tragic 7.4% |
| Paiute | 0.1 /100 | #266 | Tragic 7.4% |
| Pennsylvania Germans | 0.1 /100 | #267 | Tragic 7.4% |
| Immigrants | Ecuador | 0.1 /100 | #268 | Tragic 7.4% |
| Immigrants | Latin America | 0.1 /100 | #269 | Tragic 7.4% |
| Bahamians | 0.0 /100 | #270 | Tragic 7.5% |
| Choctaw | 0.0 /100 | #271 | Tragic 7.5% |
| Immigrants | Bahamas | 0.0 /100 | #272 | Tragic 7.5% |
| Immigrants | Nigeria | 0.0 /100 | #273 | Tragic 7.5% |
| Immigrants | Central America | 0.0 /100 | #274 | Tragic 7.5% |
| Immigrants | Ghana | 0.0 /100 | #275 | Tragic 7.5% |
| French American Indians | 0.0 /100 | #276 | Tragic 7.5% |
| Iroquois | 0.0 /100 | #277 | Tragic 7.5% |
| Mexicans | 0.0 /100 | #278 | Tragic 7.5% |
Demographics Similar to Immigrants from Kenya by Unemployment Among Ages 25 to 29 years
In terms of unemployment among ages 25 to 29 years, the demographic groups most similar to Immigrants from Kenya are Fijian (6.1%, a difference of 0.040%), Jordanian (6.1%, a difference of 0.070%), Indonesian (6.1%, a difference of 0.13%), Czech (6.2%, a difference of 0.20%), and Mongolian (6.2%, a difference of 0.25%).
| Demographics | Rating | Rank | Unemployment Among Ages 25 to 29 years |
| Yugoslavians | 99.6 /100 | #33 | Exceptional 6.1% |
| Immigrants | Morocco | 99.5 /100 | #34 | Exceptional 6.1% |
| Immigrants | Zimbabwe | 99.5 /100 | #35 | Exceptional 6.1% |
| Taiwanese | 99.5 /100 | #36 | Exceptional 6.1% |
| Immigrants | Serbia | 99.5 /100 | #37 | Exceptional 6.1% |
| Ethiopians | 99.4 /100 | #38 | Exceptional 6.1% |
| Indonesians | 99.3 /100 | #39 | Exceptional 6.1% |
| Immigrants | Kenya | 99.3 /100 | #40 | Exceptional 6.1% |
| Fijians | 99.3 /100 | #41 | Exceptional 6.1% |
| Jordanians | 99.3 /100 | #42 | Exceptional 6.1% |
| Czechs | 99.2 /100 | #43 | Exceptional 6.2% |
| Mongolians | 99.2 /100 | #44 | Exceptional 6.2% |
| Venezuelans | 99.1 /100 | #45 | Exceptional 6.2% |
| Immigrants | Lithuania | 99.0 /100 | #46 | Exceptional 6.2% |
| Latvians | 99.0 /100 | #47 | Exceptional 6.2% |