Immigrants from Philippines vs Australian Unemployment Among Ages 20 to 24 years
COMPARE
Immigrants from Philippines
Australian
Unemployment Among Ages 20 to 24 years
Unemployment Among Ages 20 to 24 years Comparison
Immigrants from Philippines
Australians
10.4%
UNEMPLOYMENT AMONG AGES 20 TO 24 YEARS
24.1/ 100
METRIC RATING
196th/ 347
METRIC RANK
9.6%
UNEMPLOYMENT AMONG AGES 20 TO 24 YEARS
100.0/ 100
METRIC RATING
33rd/ 347
METRIC RANK
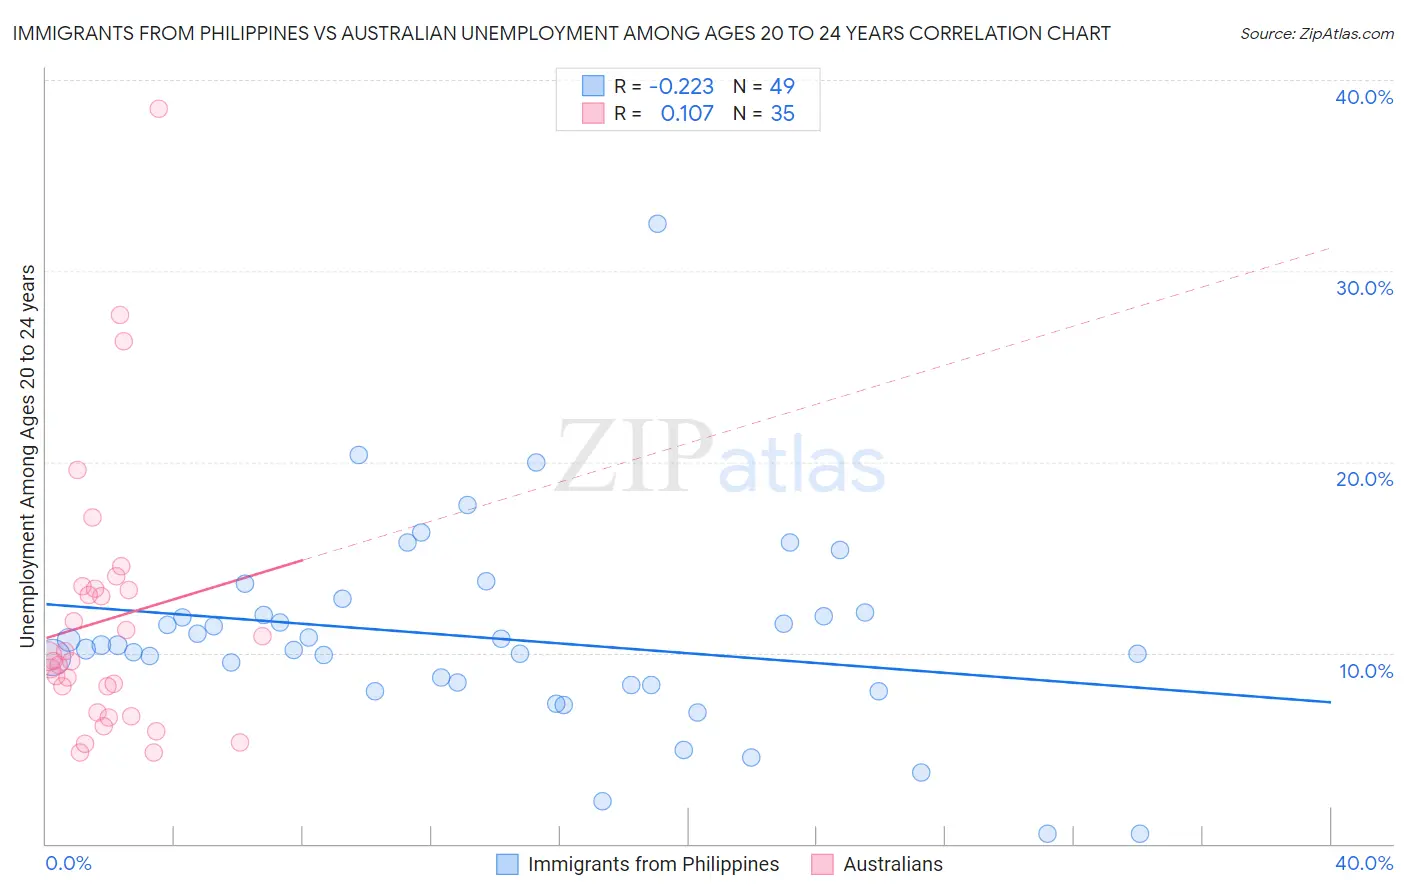
Immigrants from Philippines vs Australian Unemployment Among Ages 20 to 24 years Correlation Chart
The statistical analysis conducted on geographies consisting of 452,195,807 people shows a weak negative correlation between the proportion of Immigrants from Philippines and unemployment rate among population between the ages 20 and 24 in the United States with a correlation coefficient (R) of -0.223 and weighted average of 10.4%. Similarly, the statistical analysis conducted on geographies consisting of 219,577,245 people shows a poor positive correlation between the proportion of Australians and unemployment rate among population between the ages 20 and 24 in the United States with a correlation coefficient (R) of 0.107 and weighted average of 9.6%, a difference of 9.0%.
Unemployment Among Ages 20 to 24 years Correlation Summary
| Measurement | Immigrants from Philippines | Australian |
| Minimum | 0.50% | 4.7% |
| Maximum | 32.5% | 38.5% |
| Range | 32.0% | 33.8% |
| Mean | 10.8% | 11.7% |
| Median | 10.4% | 9.6% |
| Interquartile 25% (IQ1) | 8.3% | 6.9% |
| Interquartile 75% (IQ3) | 12.0% | 13.4% |
| Interquartile Range (IQR) | 3.7% | 6.5% |
| Standard Deviation (Sample) | 5.2% | 7.1% |
| Standard Deviation (Population) | 5.2% | 7.0% |
Similar Demographics by Unemployment Among Ages 20 to 24 years
Demographics Similar to Immigrants from Philippines by Unemployment Among Ages 20 to 24 years
In terms of unemployment among ages 20 to 24 years, the demographic groups most similar to Immigrants from Philippines are Egyptian (10.4%, a difference of 0.020%), Immigrants from Italy (10.4%, a difference of 0.050%), Immigrants from Portugal (10.4%, a difference of 0.060%), Immigrants from Denmark (10.4%, a difference of 0.060%), and Ugandan (10.4%, a difference of 0.080%).
| Demographics | Rating | Rank | Unemployment Among Ages 20 to 24 years |
| Hawaiians | 33.9 /100 | #189 | Fair 10.4% |
| Immigrants | China | 32.6 /100 | #190 | Fair 10.4% |
| Immigrants | Eastern Europe | 25.8 /100 | #191 | Fair 10.4% |
| Ugandans | 25.7 /100 | #192 | Fair 10.4% |
| Immigrants | Portugal | 25.3 /100 | #193 | Fair 10.4% |
| Immigrants | Italy | 25.0 /100 | #194 | Fair 10.4% |
| Egyptians | 24.5 /100 | #195 | Fair 10.4% |
| Immigrants | Philippines | 24.1 /100 | #196 | Fair 10.4% |
| Immigrants | Denmark | 22.8 /100 | #197 | Fair 10.4% |
| Colombians | 22.3 /100 | #198 | Fair 10.4% |
| Portuguese | 21.8 /100 | #199 | Fair 10.4% |
| Russians | 21.2 /100 | #200 | Fair 10.4% |
| Immigrants | Peru | 21.2 /100 | #201 | Fair 10.4% |
| Immigrants | Middle Africa | 20.9 /100 | #202 | Fair 10.4% |
| South Americans | 20.6 /100 | #203 | Fair 10.4% |
Demographics Similar to Australians by Unemployment Among Ages 20 to 24 years
In terms of unemployment among ages 20 to 24 years, the demographic groups most similar to Australians are Cambodian (9.5%, a difference of 0.11%), Immigrants from Eastern Africa (9.5%, a difference of 0.16%), Yugoslavian (9.6%, a difference of 0.20%), Scandinavian (9.5%, a difference of 0.24%), and Immigrants from North Macedonia (9.5%, a difference of 0.26%).
| Demographics | Rating | Rank | Unemployment Among Ages 20 to 24 years |
| Swedes | 100.0 /100 | #26 | Exceptional 9.5% |
| Immigrants | Zimbabwe | 100.0 /100 | #27 | Exceptional 9.5% |
| Immigrants | Afghanistan | 100.0 /100 | #28 | Exceptional 9.5% |
| Immigrants | North Macedonia | 100.0 /100 | #29 | Exceptional 9.5% |
| Scandinavians | 100.0 /100 | #30 | Exceptional 9.5% |
| Immigrants | Eastern Africa | 100.0 /100 | #31 | Exceptional 9.5% |
| Cambodians | 100.0 /100 | #32 | Exceptional 9.5% |
| Australians | 100.0 /100 | #33 | Exceptional 9.6% |
| Yugoslavians | 100.0 /100 | #34 | Exceptional 9.6% |
| Germans | 100.0 /100 | #35 | Exceptional 9.6% |
| Belgians | 100.0 /100 | #36 | Exceptional 9.6% |
| Immigrants | Zaire | 100.0 /100 | #37 | Exceptional 9.6% |
| Afghans | 99.9 /100 | #38 | Exceptional 9.6% |
| Dutch | 99.9 /100 | #39 | Exceptional 9.6% |
| Immigrants | Ethiopia | 99.9 /100 | #40 | Exceptional 9.6% |