Chippewa vs African Unemployment Among Ages 20 to 24 years
COMPARE
Chippewa
African
Unemployment Among Ages 20 to 24 years
Unemployment Among Ages 20 to 24 years Comparison
Chippewa
Africans
12.3%
UNEMPLOYMENT AMONG AGES 20 TO 24 YEARS
0.0/ 100
METRIC RATING
305th/ 347
METRIC RANK
11.5%
UNEMPLOYMENT AMONG AGES 20 TO 24 YEARS
0.0/ 100
METRIC RATING
277th/ 347
METRIC RANK
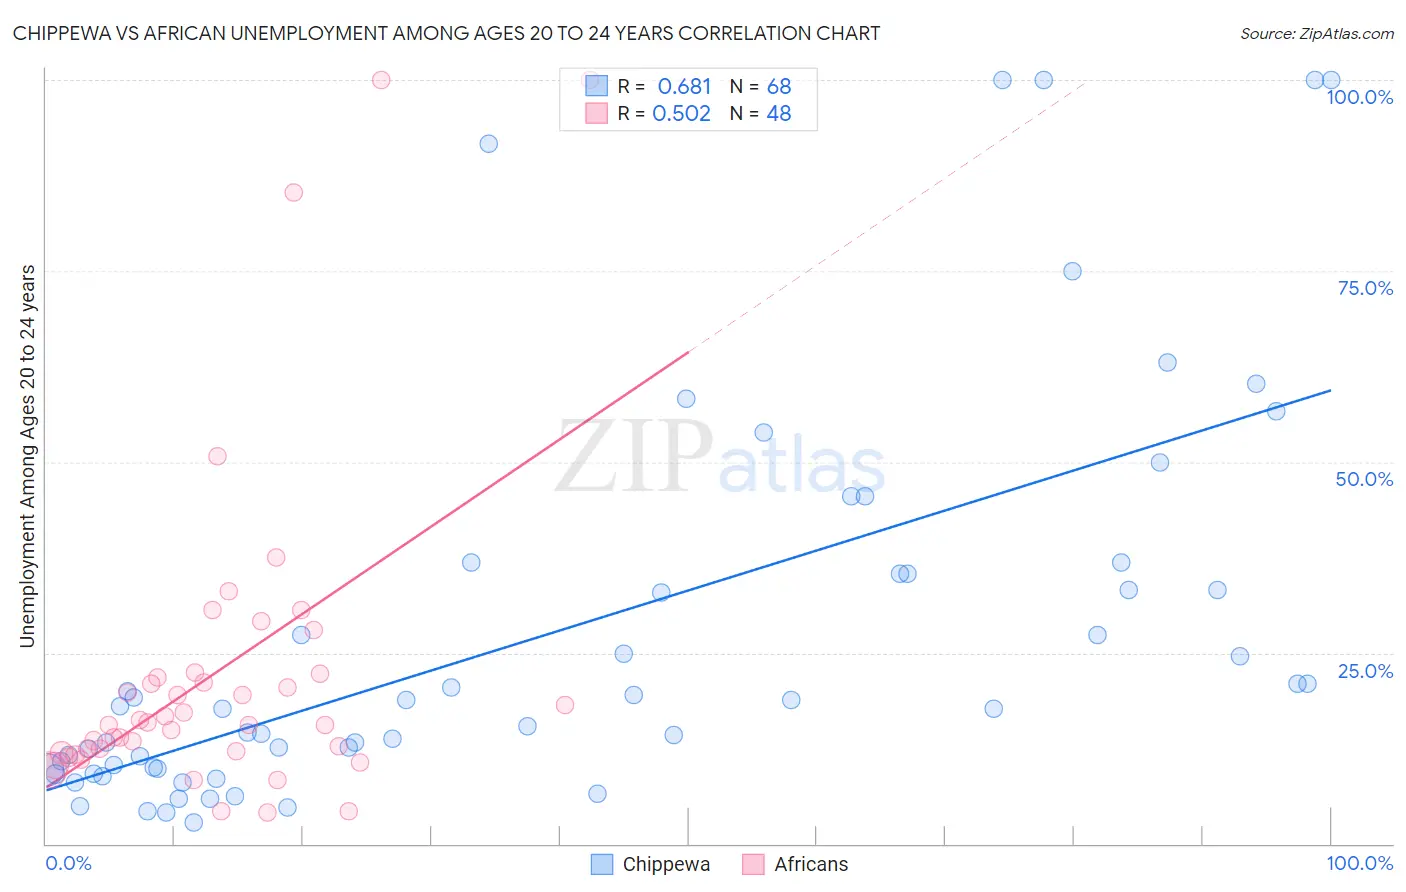
Chippewa vs African Unemployment Among Ages 20 to 24 years Correlation Chart
The statistical analysis conducted on geographies consisting of 208,606,929 people shows a significant positive correlation between the proportion of Chippewa and unemployment rate among population between the ages 20 and 24 in the United States with a correlation coefficient (R) of 0.681 and weighted average of 12.3%. Similarly, the statistical analysis conducted on geographies consisting of 452,548,100 people shows a substantial positive correlation between the proportion of Africans and unemployment rate among population between the ages 20 and 24 in the United States with a correlation coefficient (R) of 0.502 and weighted average of 11.5%, a difference of 6.5%.
Unemployment Among Ages 20 to 24 years Correlation Summary
| Measurement | Chippewa | African |
| Minimum | 2.8% | 4.0% |
| Maximum | 100.0% | 100.0% |
| Range | 97.2% | 96.0% |
| Mean | 27.4% | 22.3% |
| Median | 17.8% | 15.7% |
| Interquartile 25% (IQ1) | 9.9% | 12.0% |
| Interquartile 75% (IQ3) | 35.4% | 22.0% |
| Interquartile Range (IQR) | 25.5% | 10.0% |
| Standard Deviation (Sample) | 26.0% | 21.0% |
| Standard Deviation (Population) | 25.8% | 20.8% |
Similar Demographics by Unemployment Among Ages 20 to 24 years
Demographics Similar to Chippewa by Unemployment Among Ages 20 to 24 years
In terms of unemployment among ages 20 to 24 years, the demographic groups most similar to Chippewa are Immigrants from West Indies (12.3%, a difference of 0.040%), Haitian (12.2%, a difference of 0.64%), Immigrants from Cabo Verde (12.2%, a difference of 0.65%), Immigrants from Haiti (12.4%, a difference of 0.84%), and Bermudan (12.5%, a difference of 1.3%).
| Demographics | Rating | Rank | Unemployment Among Ages 20 to 24 years |
| Lumbee | 0.0 /100 | #298 | Tragic 12.0% |
| Apache | 0.0 /100 | #299 | Tragic 12.0% |
| Spanish American Indians | 0.0 /100 | #300 | Tragic 12.1% |
| Immigrants | Sierra Leone | 0.0 /100 | #301 | Tragic 12.1% |
| Immigrants | Cabo Verde | 0.0 /100 | #302 | Tragic 12.2% |
| Haitians | 0.0 /100 | #303 | Tragic 12.2% |
| Immigrants | West Indies | 0.0 /100 | #304 | Tragic 12.3% |
| Chippewa | 0.0 /100 | #305 | Tragic 12.3% |
| Immigrants | Haiti | 0.0 /100 | #306 | Tragic 12.4% |
| Bermudans | 0.0 /100 | #307 | Tragic 12.5% |
| Tohono O'odham | 0.0 /100 | #308 | Tragic 12.5% |
| Immigrants | Bangladesh | 0.0 /100 | #309 | Tragic 12.6% |
| Jamaicans | 0.0 /100 | #310 | Tragic 12.6% |
| Vietnamese | 0.0 /100 | #311 | Tragic 12.6% |
| Houma | 0.0 /100 | #312 | Tragic 12.6% |
Demographics Similar to Africans by Unemployment Among Ages 20 to 24 years
In terms of unemployment among ages 20 to 24 years, the demographic groups most similar to Africans are Colville (11.6%, a difference of 0.030%), Sierra Leonean (11.5%, a difference of 0.15%), Senegalese (11.5%, a difference of 0.19%), Bahamian (11.6%, a difference of 0.28%), and Cape Verdean (11.5%, a difference of 0.54%).
| Demographics | Rating | Rank | Unemployment Among Ages 20 to 24 years |
| Delaware | 0.0 /100 | #270 | Tragic 11.3% |
| Immigrants | Uzbekistan | 0.0 /100 | #271 | Tragic 11.4% |
| Nigerians | 0.0 /100 | #272 | Tragic 11.4% |
| Immigrants | Nigeria | 0.0 /100 | #273 | Tragic 11.5% |
| Cape Verdeans | 0.0 /100 | #274 | Tragic 11.5% |
| Senegalese | 0.0 /100 | #275 | Tragic 11.5% |
| Sierra Leoneans | 0.0 /100 | #276 | Tragic 11.5% |
| Africans | 0.0 /100 | #277 | Tragic 11.5% |
| Colville | 0.0 /100 | #278 | Tragic 11.6% |
| Bahamians | 0.0 /100 | #279 | Tragic 11.6% |
| Alaskan Athabascans | 0.0 /100 | #280 | Tragic 11.6% |
| Armenians | 0.0 /100 | #281 | Tragic 11.7% |
| Immigrants | Cameroon | 0.0 /100 | #282 | Tragic 11.7% |
| Ghanaians | 0.0 /100 | #283 | Tragic 11.7% |
| Immigrants | Western Africa | 0.0 /100 | #284 | Tragic 11.7% |