Cajun vs Tsimshian Female Unemployment
COMPARE
Cajun
Tsimshian
Female Unemployment
Female Unemployment Comparison
Cajuns
Tsimshian
5.7%
FEMALE UNEMPLOYMENT
0.7/ 100
METRIC RATING
252nd/ 347
METRIC RANK
5.4%
FEMALE UNEMPLOYMENT
23.1/ 100
METRIC RATING
198th/ 347
METRIC RANK
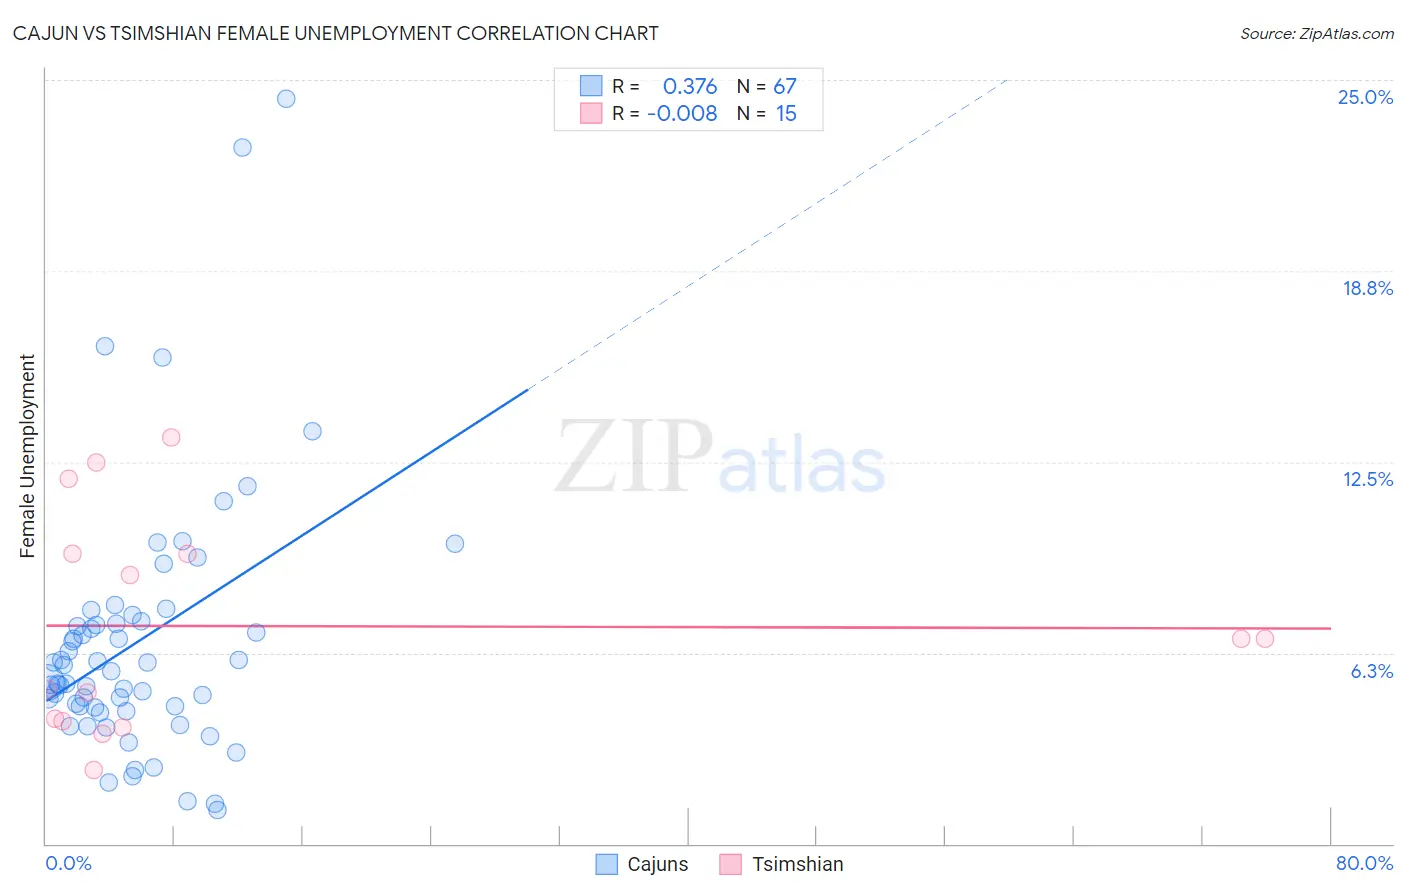
Cajun vs Tsimshian Female Unemployment Correlation Chart
The statistical analysis conducted on geographies consisting of 149,152,884 people shows a mild positive correlation between the proportion of Cajuns and unemploymnet rate among females in the United States with a correlation coefficient (R) of 0.376 and weighted average of 5.7%. Similarly, the statistical analysis conducted on geographies consisting of 15,620,666 people shows no correlation between the proportion of Tsimshian and unemploymnet rate among females in the United States with a correlation coefficient (R) of -0.008 and weighted average of 5.4%, a difference of 5.6%.
Female Unemployment Correlation Summary
| Measurement | Cajun | Tsimshian |
| Minimum | 1.1% | 2.4% |
| Maximum | 24.4% | 13.3% |
| Range | 23.3% | 10.9% |
| Mean | 6.6% | 7.1% |
| Median | 5.6% | 6.7% |
| Interquartile 25% (IQ1) | 4.4% | 4.0% |
| Interquartile 75% (IQ3) | 7.3% | 9.5% |
| Interquartile Range (IQR) | 2.8% | 5.5% |
| Standard Deviation (Sample) | 4.3% | 3.6% |
| Standard Deviation (Population) | 4.2% | 3.4% |
Similar Demographics by Female Unemployment
Demographics Similar to Cajuns by Female Unemployment
In terms of female unemployment, the demographic groups most similar to Cajuns are Immigrants from Sierra Leone (5.7%, a difference of 0.15%), Immigrants (5.7%, a difference of 0.15%), Immigrants from Cameroon (5.7%, a difference of 0.18%), Assyrian/Chaldean/Syriac (5.6%, a difference of 0.20%), and Immigrants from Syria (5.6%, a difference of 0.26%).
| Demographics | Rating | Rank | Female Unemployment |
| Guamanians/Chamorros | 1.4 /100 | #245 | Tragic 5.6% |
| Japanese | 1.2 /100 | #246 | Tragic 5.6% |
| Immigrants | Western Asia | 1.1 /100 | #247 | Tragic 5.6% |
| Cree | 1.0 /100 | #248 | Tragic 5.6% |
| Immigrants | Uzbekistan | 1.0 /100 | #249 | Tragic 5.6% |
| Immigrants | Syria | 0.8 /100 | #250 | Tragic 5.6% |
| Assyrians/Chaldeans/Syriacs | 0.8 /100 | #251 | Tragic 5.6% |
| Cajuns | 0.7 /100 | #252 | Tragic 5.7% |
| Immigrants | Sierra Leone | 0.6 /100 | #253 | Tragic 5.7% |
| Immigrants | Immigrants | 0.6 /100 | #254 | Tragic 5.7% |
| Immigrants | Cameroon | 0.6 /100 | #255 | Tragic 5.7% |
| Sub-Saharan Africans | 0.4 /100 | #256 | Tragic 5.7% |
| Dutch West Indians | 0.3 /100 | #257 | Tragic 5.7% |
| Immigrants | Portugal | 0.2 /100 | #258 | Tragic 5.8% |
| Immigrants | Fiji | 0.2 /100 | #259 | Tragic 5.8% |
Demographics Similar to Tsimshian by Female Unemployment
In terms of female unemployment, the demographic groups most similar to Tsimshian are Alsatian (5.3%, a difference of 0.070%), Hawaiian (5.4%, a difference of 0.080%), Soviet Union (5.4%, a difference of 0.12%), Spaniard (5.3%, a difference of 0.17%), and Immigrants from Middle Africa (5.4%, a difference of 0.20%).
| Demographics | Rating | Rank | Female Unemployment |
| Cherokee | 30.8 /100 | #191 | Fair 5.3% |
| Portuguese | 28.6 /100 | #192 | Fair 5.3% |
| Arabs | 27.7 /100 | #193 | Fair 5.3% |
| Colombians | 27.0 /100 | #194 | Fair 5.3% |
| Immigrants | Colombia | 26.2 /100 | #195 | Fair 5.3% |
| Spaniards | 25.2 /100 | #196 | Fair 5.3% |
| Alsatians | 23.9 /100 | #197 | Fair 5.3% |
| Tsimshian | 23.1 /100 | #198 | Fair 5.4% |
| Hawaiians | 22.2 /100 | #199 | Fair 5.4% |
| Soviet Union | 21.7 /100 | #200 | Fair 5.4% |
| Immigrants | Middle Africa | 20.8 /100 | #201 | Fair 5.4% |
| Iroquois | 20.8 /100 | #202 | Fair 5.4% |
| Immigrants | South Eastern Asia | 20.3 /100 | #203 | Fair 5.4% |
| Immigrants | Israel | 19.7 /100 | #204 | Poor 5.4% |
| Immigrants | Afghanistan | 18.9 /100 | #205 | Poor 5.4% |