Soviet Union vs Immigrants from Haiti Male Unemployment
COMPARE
Soviet Union
Immigrants from Haiti
Male Unemployment
Male Unemployment Comparison
Soviet Union
Immigrants from Haiti
5.6%
MALE UNEMPLOYMENT
3.2/ 100
METRIC RATING
221st/ 347
METRIC RANK
6.5%
MALE UNEMPLOYMENT
0.0/ 100
METRIC RATING
296th/ 347
METRIC RANK
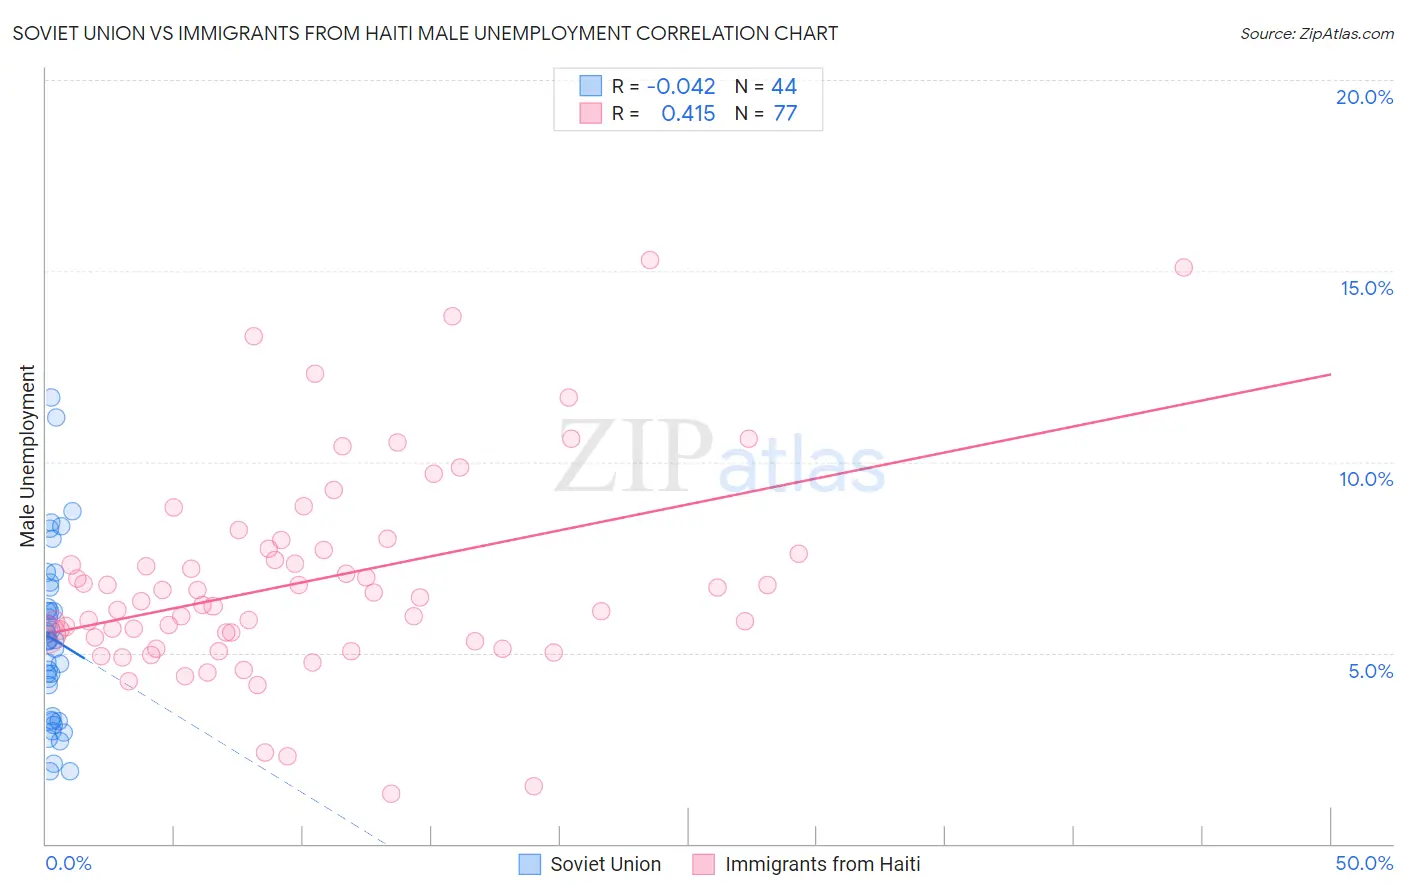
Soviet Union vs Immigrants from Haiti Male Unemployment Correlation Chart
The statistical analysis conducted on geographies consisting of 43,494,943 people shows no correlation between the proportion of Soviet Union and unemployment rate among males in the United States with a correlation coefficient (R) of -0.042 and weighted average of 5.6%. Similarly, the statistical analysis conducted on geographies consisting of 224,769,713 people shows a moderate positive correlation between the proportion of Immigrants from Haiti and unemployment rate among males in the United States with a correlation coefficient (R) of 0.415 and weighted average of 6.5%, a difference of 17.5%.
Male Unemployment Correlation Summary
| Measurement | Soviet Union | Immigrants from Haiti |
| Minimum | 1.9% | 1.3% |
| Maximum | 11.7% | 15.3% |
| Range | 9.8% | 14.0% |
| Mean | 5.4% | 6.9% |
| Median | 5.3% | 6.3% |
| Interquartile 25% (IQ1) | 3.3% | 5.3% |
| Interquartile 75% (IQ3) | 6.4% | 7.7% |
| Interquartile Range (IQR) | 3.1% | 2.4% |
| Standard Deviation (Sample) | 2.3% | 2.7% |
| Standard Deviation (Population) | 2.2% | 2.7% |
Similar Demographics by Male Unemployment
Demographics Similar to Soviet Union by Male Unemployment
In terms of male unemployment, the demographic groups most similar to Soviet Union are Portuguese (5.6%, a difference of 0.11%), Immigrants from Western Asia (5.6%, a difference of 0.13%), Immigrants from Micronesia (5.6%, a difference of 0.14%), Immigrants from Albania (5.5%, a difference of 0.18%), and Creek (5.6%, a difference of 0.29%).
| Demographics | Rating | Rank | Male Unemployment |
| Puget Sound Salish | 5.6 /100 | #214 | Tragic 5.5% |
| Samoans | 4.9 /100 | #215 | Tragic 5.5% |
| Immigrants | Immigrants | 4.3 /100 | #216 | Tragic 5.5% |
| Delaware | 4.2 /100 | #217 | Tragic 5.5% |
| Immigrants | Albania | 3.6 /100 | #218 | Tragic 5.5% |
| Immigrants | Western Asia | 3.5 /100 | #219 | Tragic 5.6% |
| Portuguese | 3.5 /100 | #220 | Tragic 5.6% |
| Soviet Union | 3.2 /100 | #221 | Tragic 5.6% |
| Immigrants | Micronesia | 2.9 /100 | #222 | Tragic 5.6% |
| Creek | 2.6 /100 | #223 | Tragic 5.6% |
| Cherokee | 2.4 /100 | #224 | Tragic 5.6% |
| Panamanians | 1.9 /100 | #225 | Tragic 5.6% |
| Immigrants | Cambodia | 1.8 /100 | #226 | Tragic 5.6% |
| Immigrants | Panama | 1.8 /100 | #227 | Tragic 5.6% |
| Seminole | 1.8 /100 | #228 | Tragic 5.6% |
Demographics Similar to Immigrants from Haiti by Male Unemployment
In terms of male unemployment, the demographic groups most similar to Immigrants from Haiti are Chippewa (6.6%, a difference of 0.32%), Jamaican (6.6%, a difference of 0.40%), Belizean (6.5%, a difference of 0.45%), Immigrants from Bangladesh (6.6%, a difference of 0.53%), and Vietnamese (6.6%, a difference of 0.80%).
| Demographics | Rating | Rank | Male Unemployment |
| Immigrants | Caribbean | 0.0 /100 | #289 | Tragic 6.3% |
| U.S. Virgin Islanders | 0.0 /100 | #290 | Tragic 6.4% |
| Immigrants | Azores | 0.0 /100 | #291 | Tragic 6.4% |
| Nepalese | 0.0 /100 | #292 | Tragic 6.4% |
| Haitians | 0.0 /100 | #293 | Tragic 6.4% |
| Senegalese | 0.0 /100 | #294 | Tragic 6.4% |
| Belizeans | 0.0 /100 | #295 | Tragic 6.5% |
| Immigrants | Haiti | 0.0 /100 | #296 | Tragic 6.5% |
| Chippewa | 0.0 /100 | #297 | Tragic 6.6% |
| Jamaicans | 0.0 /100 | #298 | Tragic 6.6% |
| Immigrants | Bangladesh | 0.0 /100 | #299 | Tragic 6.6% |
| Vietnamese | 0.0 /100 | #300 | Tragic 6.6% |
| Immigrants | Belize | 0.0 /100 | #301 | Tragic 6.6% |
| Ute | 0.0 /100 | #302 | Tragic 6.6% |
| Immigrants | West Indies | 0.0 /100 | #303 | Tragic 6.7% |