Central American vs Immigrants from Switzerland Unemployment Among Ages 30 to 34 years
COMPARE
Central American
Immigrants from Switzerland
Unemployment Among Ages 30 to 34 years
Unemployment Among Ages 30 to 34 years Comparison
Central Americans
Immigrants from Switzerland
5.9%
UNEMPLOYMENT AMONG AGES 30 TO 34 YEARS
0.6/ 100
METRIC RATING
237th/ 347
METRIC RANK
5.3%
UNEMPLOYMENT AMONG AGES 30 TO 34 YEARS
88.8/ 100
METRIC RATING
102nd/ 347
METRIC RANK
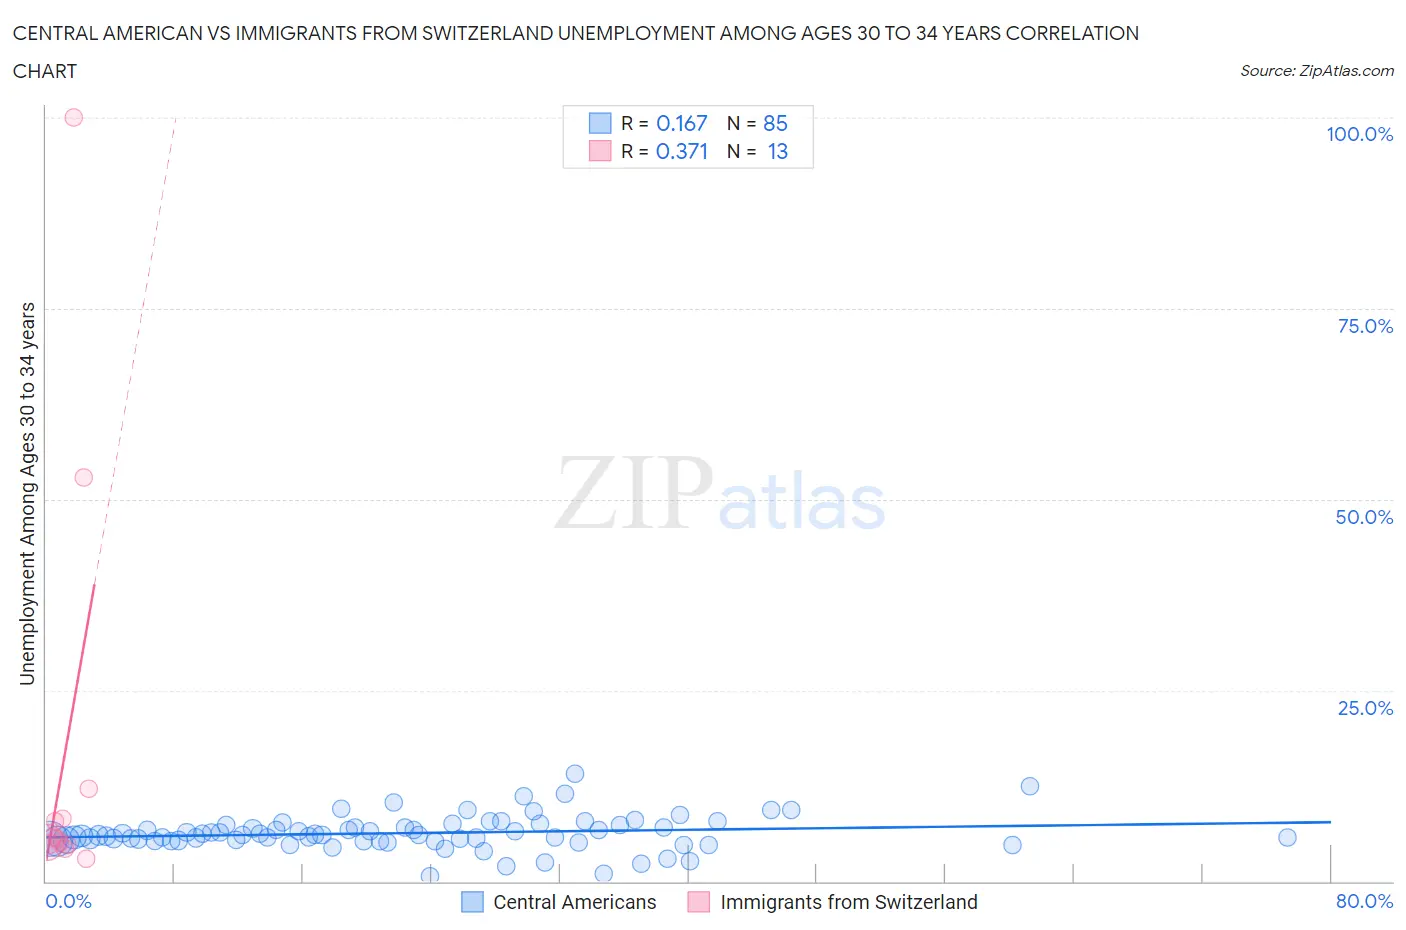
Central American vs Immigrants from Switzerland Unemployment Among Ages 30 to 34 years Correlation Chart
The statistical analysis conducted on geographies consisting of 462,932,276 people shows a poor positive correlation between the proportion of Central Americans and unemployment rate among population between the ages 30 and 34 in the United States with a correlation coefficient (R) of 0.167 and weighted average of 5.9%. Similarly, the statistical analysis conducted on geographies consisting of 143,011,464 people shows a mild positive correlation between the proportion of Immigrants from Switzerland and unemployment rate among population between the ages 30 and 34 in the United States with a correlation coefficient (R) of 0.371 and weighted average of 5.3%, a difference of 12.9%.
Unemployment Among Ages 30 to 34 years Correlation Summary
| Measurement | Central American | Immigrants from Switzerland |
| Minimum | 0.70% | 2.9% |
| Maximum | 14.0% | 100.0% |
| Range | 13.3% | 97.1% |
| Mean | 6.3% | 16.9% |
| Median | 6.0% | 5.5% |
| Interquartile 25% (IQ1) | 5.3% | 4.8% |
| Interquartile 75% (IQ3) | 7.3% | 10.1% |
| Interquartile Range (IQR) | 2.0% | 5.3% |
| Standard Deviation (Sample) | 2.2% | 28.2% |
| Standard Deviation (Population) | 2.2% | 27.1% |
Similar Demographics by Unemployment Among Ages 30 to 34 years
Demographics Similar to Central Americans by Unemployment Among Ages 30 to 34 years
In terms of unemployment among ages 30 to 34 years, the demographic groups most similar to Central Americans are Mexican American Indian (5.9%, a difference of 0.090%), Native Hawaiian (5.9%, a difference of 0.17%), Immigrants from Nigeria (6.0%, a difference of 0.17%), Yaqui (5.9%, a difference of 0.29%), and Portuguese (5.9%, a difference of 0.41%).
| Demographics | Rating | Rank | Unemployment Among Ages 30 to 34 years |
| Hawaiians | 1.2 /100 | #230 | Tragic 5.9% |
| Japanese | 1.1 /100 | #231 | Tragic 5.9% |
| Iroquois | 1.0 /100 | #232 | Tragic 5.9% |
| Nepalese | 0.8 /100 | #233 | Tragic 5.9% |
| Portuguese | 0.8 /100 | #234 | Tragic 5.9% |
| Yaqui | 0.7 /100 | #235 | Tragic 5.9% |
| Native Hawaiians | 0.7 /100 | #236 | Tragic 5.9% |
| Central Americans | 0.6 /100 | #237 | Tragic 5.9% |
| Mexican American Indians | 0.6 /100 | #238 | Tragic 5.9% |
| Immigrants | Nigeria | 0.6 /100 | #239 | Tragic 6.0% |
| Salvadorans | 0.5 /100 | #240 | Tragic 6.0% |
| Immigrants | El Salvador | 0.5 /100 | #241 | Tragic 6.0% |
| Guatemalans | 0.4 /100 | #242 | Tragic 6.0% |
| Immigrants | Liberia | 0.4 /100 | #243 | Tragic 6.0% |
| Immigrants | Micronesia | 0.3 /100 | #244 | Tragic 6.0% |
Demographics Similar to Immigrants from Switzerland by Unemployment Among Ages 30 to 34 years
In terms of unemployment among ages 30 to 34 years, the demographic groups most similar to Immigrants from Switzerland are Immigrants from Jordan (5.3%, a difference of 0.010%), British (5.3%, a difference of 0.060%), Immigrants from Czechoslovakia (5.3%, a difference of 0.13%), Northern European (5.3%, a difference of 0.17%), and Argentinean (5.3%, a difference of 0.17%).
| Demographics | Rating | Rank | Unemployment Among Ages 30 to 34 years |
| Kenyans | 92.1 /100 | #95 | Exceptional 5.2% |
| Mongolians | 91.7 /100 | #96 | Exceptional 5.2% |
| Europeans | 91.7 /100 | #97 | Exceptional 5.2% |
| Immigrants | North Macedonia | 90.9 /100 | #98 | Exceptional 5.2% |
| Immigrants | Ireland | 90.6 /100 | #99 | Exceptional 5.2% |
| Immigrants | Czechoslovakia | 89.5 /100 | #100 | Excellent 5.3% |
| British | 89.1 /100 | #101 | Excellent 5.3% |
| Immigrants | Switzerland | 88.8 /100 | #102 | Excellent 5.3% |
| Immigrants | Jordan | 88.8 /100 | #103 | Excellent 5.3% |
| Northern Europeans | 87.9 /100 | #104 | Excellent 5.3% |
| Argentineans | 87.9 /100 | #105 | Excellent 5.3% |
| Croatians | 87.6 /100 | #106 | Excellent 5.3% |
| Icelanders | 87.2 /100 | #107 | Excellent 5.3% |
| Immigrants | Middle Africa | 87.1 /100 | #108 | Excellent 5.3% |
| Immigrants | Chile | 86.7 /100 | #109 | Excellent 5.3% |