Central American vs Immigrants from Afghanistan Male Unemployment
COMPARE
Central American
Immigrants from Afghanistan
Male Unemployment
Male Unemployment Comparison
Central Americans
Immigrants from Afghanistan
5.6%
MALE UNEMPLOYMENT
1.8/ 100
METRIC RATING
229th/ 347
METRIC RANK
5.3%
MALE UNEMPLOYMENT
37.9/ 100
METRIC RATING
181st/ 347
METRIC RANK
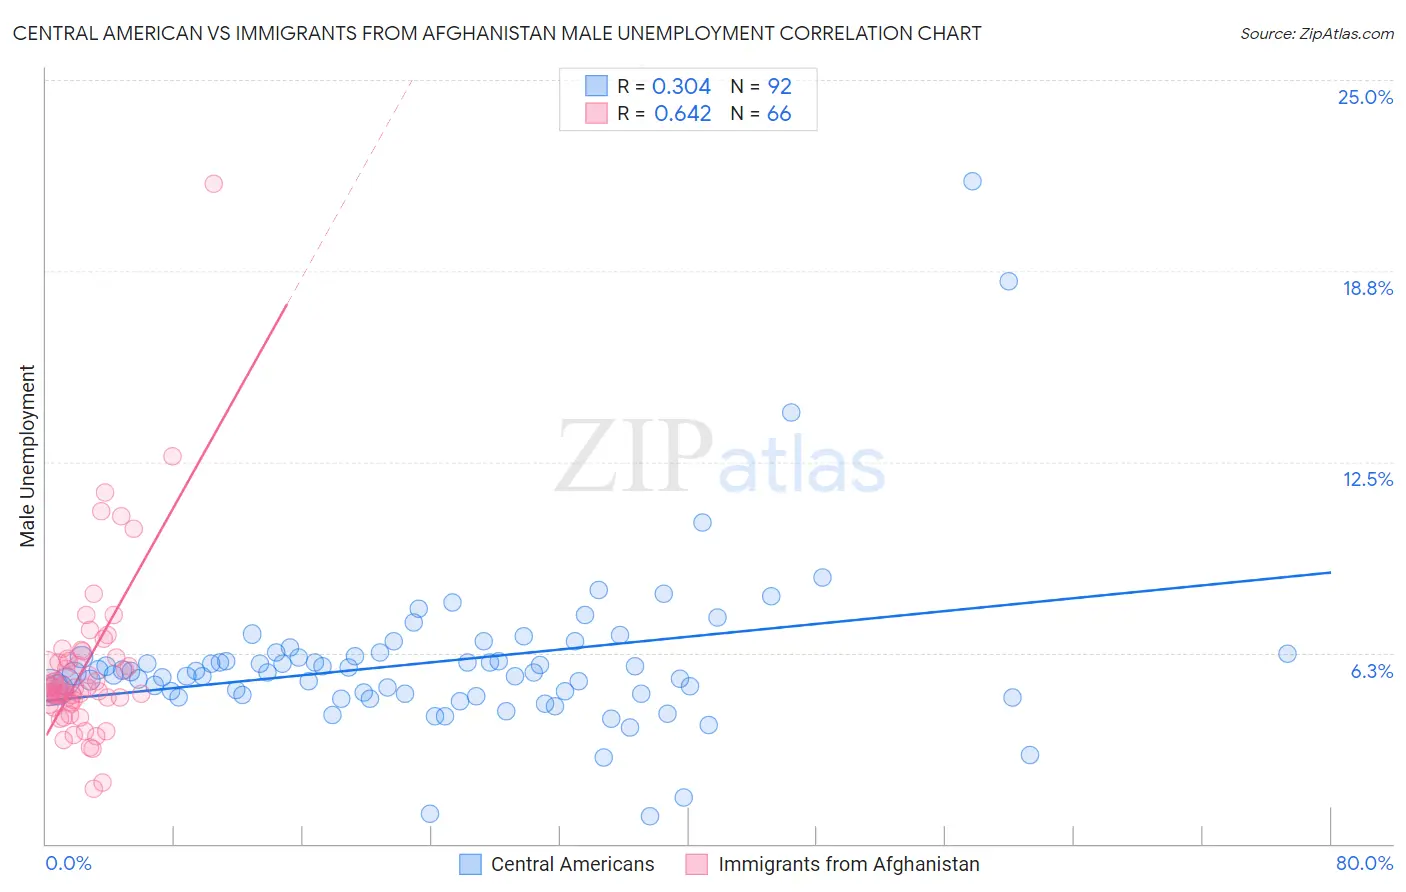
Central American vs Immigrants from Afghanistan Male Unemployment Correlation Chart
The statistical analysis conducted on geographies consisting of 500,623,781 people shows a mild positive correlation between the proportion of Central Americans and unemployment rate among males in the United States with a correlation coefficient (R) of 0.304 and weighted average of 5.6%. Similarly, the statistical analysis conducted on geographies consisting of 147,586,191 people shows a significant positive correlation between the proportion of Immigrants from Afghanistan and unemployment rate among males in the United States with a correlation coefficient (R) of 0.642 and weighted average of 5.3%, a difference of 5.1%.
Male Unemployment Correlation Summary
| Measurement | Central American | Immigrants from Afghanistan |
| Minimum | 0.90% | 1.8% |
| Maximum | 21.7% | 21.6% |
| Range | 20.8% | 19.8% |
| Mean | 5.9% | 5.8% |
| Median | 5.6% | 5.1% |
| Interquartile 25% (IQ1) | 4.9% | 4.6% |
| Interquartile 75% (IQ3) | 6.2% | 6.0% |
| Interquartile Range (IQR) | 1.3% | 1.4% |
| Standard Deviation (Sample) | 2.7% | 2.8% |
| Standard Deviation (Population) | 2.7% | 2.8% |
Similar Demographics by Male Unemployment
Demographics Similar to Central Americans by Male Unemployment
In terms of male unemployment, the demographic groups most similar to Central Americans are Seminole (5.6%, a difference of 0.0%), Immigrants from Panama (5.6%, a difference of 0.020%), Immigrants from Cambodia (5.6%, a difference of 0.030%), Immigrants from Africa (5.6%, a difference of 0.040%), and Choctaw (5.6%, a difference of 0.090%).
| Demographics | Rating | Rank | Male Unemployment |
| Immigrants | Micronesia | 2.9 /100 | #222 | Tragic 5.6% |
| Creek | 2.6 /100 | #223 | Tragic 5.6% |
| Cherokee | 2.4 /100 | #224 | Tragic 5.6% |
| Panamanians | 1.9 /100 | #225 | Tragic 5.6% |
| Immigrants | Cambodia | 1.8 /100 | #226 | Tragic 5.6% |
| Immigrants | Panama | 1.8 /100 | #227 | Tragic 5.6% |
| Seminole | 1.8 /100 | #228 | Tragic 5.6% |
| Central Americans | 1.8 /100 | #229 | Tragic 5.6% |
| Immigrants | Africa | 1.7 /100 | #230 | Tragic 5.6% |
| Choctaw | 1.6 /100 | #231 | Tragic 5.6% |
| Moroccans | 1.6 /100 | #232 | Tragic 5.6% |
| Somalis | 1.5 /100 | #233 | Tragic 5.6% |
| Immigrants | Somalia | 1.5 /100 | #234 | Tragic 5.6% |
| Immigrants | Honduras | 1.5 /100 | #235 | Tragic 5.6% |
| Guatemalans | 1.2 /100 | #236 | Tragic 5.6% |
Demographics Similar to Immigrants from Afghanistan by Male Unemployment
In terms of male unemployment, the demographic groups most similar to Immigrants from Afghanistan are Potawatomi (5.3%, a difference of 0.010%), Taiwanese (5.3%, a difference of 0.020%), Malaysian (5.3%, a difference of 0.10%), Immigrants from Oceania (5.3%, a difference of 0.18%), and Spaniard (5.3%, a difference of 0.18%).
| Demographics | Rating | Rank | Male Unemployment |
| Immigrants | Iran | 50.0 /100 | #174 | Average 5.3% |
| Immigrants | Iraq | 48.1 /100 | #175 | Average 5.3% |
| Immigrants | Poland | 46.0 /100 | #176 | Average 5.3% |
| Immigrants | Peru | 44.6 /100 | #177 | Average 5.3% |
| Osage | 42.5 /100 | #178 | Average 5.3% |
| Immigrants | Oceania | 40.8 /100 | #179 | Average 5.3% |
| Malaysians | 39.6 /100 | #180 | Fair 5.3% |
| Immigrants | Afghanistan | 37.9 /100 | #181 | Fair 5.3% |
| Potawatomi | 37.8 /100 | #182 | Fair 5.3% |
| Taiwanese | 37.6 /100 | #183 | Fair 5.3% |
| Spaniards | 35.1 /100 | #184 | Fair 5.3% |
| Koreans | 34.9 /100 | #185 | Fair 5.3% |
| Iraqis | 31.6 /100 | #186 | Fair 5.4% |
| Costa Ricans | 31.3 /100 | #187 | Fair 5.4% |
| Arabs | 30.2 /100 | #188 | Fair 5.4% |