Immigrants from Turkey vs Pennsylvania German Male Unemployment
COMPARE
Immigrants from Turkey
Pennsylvania German
Male Unemployment
Male Unemployment Comparison
Immigrants from Turkey
Pennsylvania Germans
5.1%
MALE UNEMPLOYMENT
94.4/ 100
METRIC RATING
91st/ 347
METRIC RANK
4.8%
MALE UNEMPLOYMENT
99.9/ 100
METRIC RATING
20th/ 347
METRIC RANK
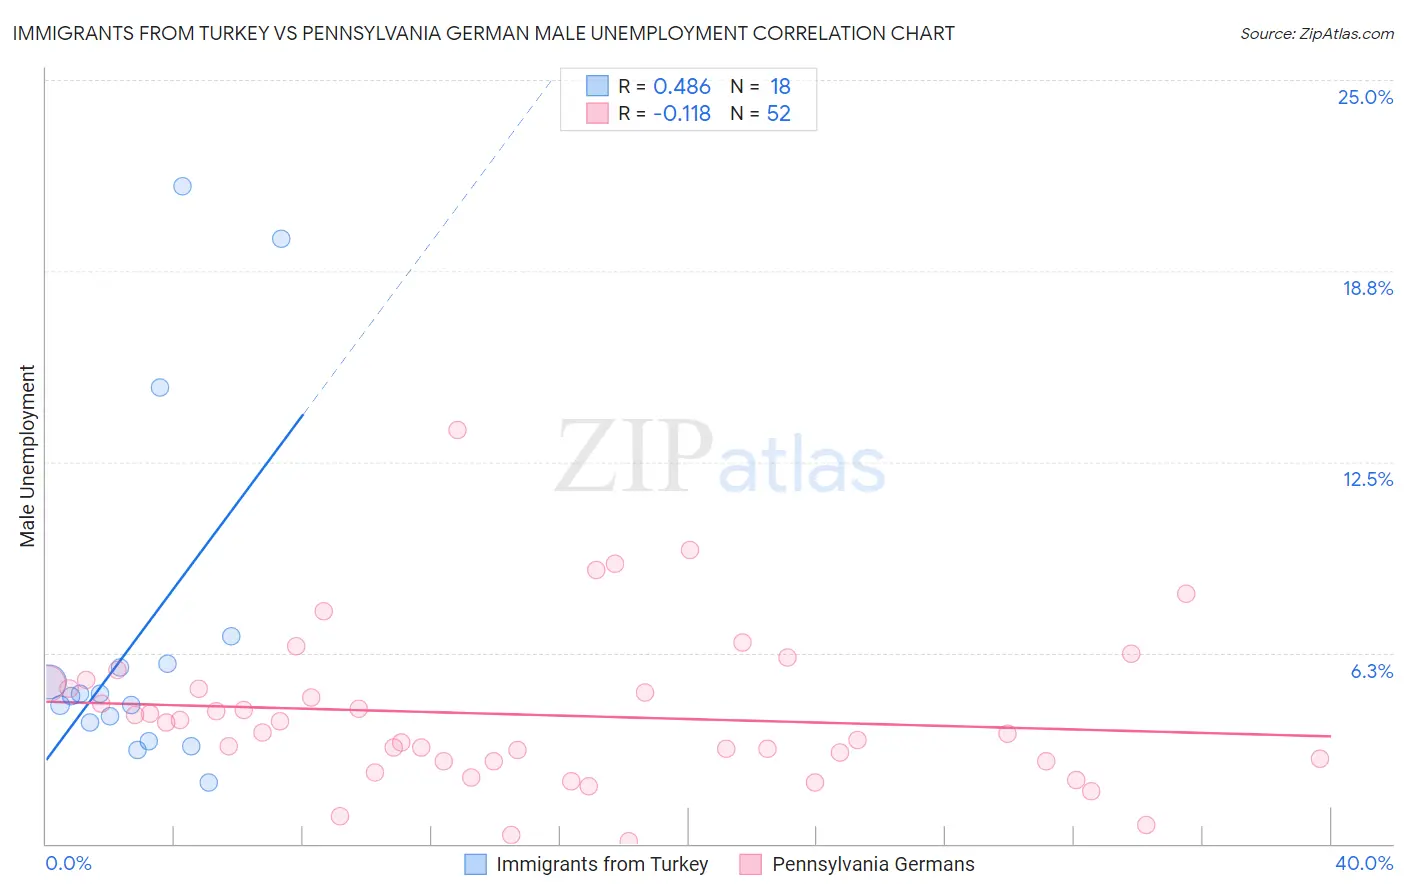
Immigrants from Turkey vs Pennsylvania German Male Unemployment Correlation Chart
The statistical analysis conducted on geographies consisting of 222,708,135 people shows a moderate positive correlation between the proportion of Immigrants from Turkey and unemployment rate among males in the United States with a correlation coefficient (R) of 0.486 and weighted average of 5.1%. Similarly, the statistical analysis conducted on geographies consisting of 232,803,431 people shows a poor negative correlation between the proportion of Pennsylvania Germans and unemployment rate among males in the United States with a correlation coefficient (R) of -0.118 and weighted average of 4.8%, a difference of 6.6%.
Male Unemployment Correlation Summary
| Measurement | Immigrants from Turkey | Pennsylvania German |
| Minimum | 2.0% | 0.10% |
| Maximum | 21.5% | 13.5% |
| Range | 19.5% | 13.4% |
| Mean | 6.9% | 4.2% |
| Median | 4.9% | 3.8% |
| Interquartile 25% (IQ1) | 4.0% | 2.7% |
| Interquartile 75% (IQ3) | 5.9% | 5.2% |
| Interquartile Range (IQR) | 1.9% | 2.5% |
| Standard Deviation (Sample) | 5.7% | 2.5% |
| Standard Deviation (Population) | 5.5% | 2.5% |
Similar Demographics by Male Unemployment
Demographics Similar to Immigrants from Turkey by Male Unemployment
In terms of male unemployment, the demographic groups most similar to Immigrants from Turkey are Slavic (5.1%, a difference of 0.060%), Immigrants from Serbia (5.1%, a difference of 0.060%), Okinawan (5.1%, a difference of 0.080%), Immigrants from Australia (5.1%, a difference of 0.090%), and Canadian (5.1%, a difference of 0.10%).
| Demographics | Rating | Rank | Male Unemployment |
| Serbians | 95.7 /100 | #84 | Exceptional 5.1% |
| Immigrants | North Macedonia | 95.6 /100 | #85 | Exceptional 5.1% |
| Maltese | 95.5 /100 | #86 | Exceptional 5.1% |
| Immigrants | Romania | 95.4 /100 | #87 | Exceptional 5.1% |
| Immigrants | Sri Lanka | 94.9 /100 | #88 | Exceptional 5.1% |
| Immigrants | Australia | 94.7 /100 | #89 | Exceptional 5.1% |
| Okinawans | 94.7 /100 | #90 | Exceptional 5.1% |
| Immigrants | Turkey | 94.4 /100 | #91 | Exceptional 5.1% |
| Slavs | 94.2 /100 | #92 | Exceptional 5.1% |
| Immigrants | Serbia | 94.2 /100 | #93 | Exceptional 5.1% |
| Canadians | 94.1 /100 | #94 | Exceptional 5.1% |
| Italians | 93.8 /100 | #95 | Exceptional 5.1% |
| Asians | 93.7 /100 | #96 | Exceptional 5.1% |
| Immigrants | Spain | 93.4 /100 | #97 | Exceptional 5.1% |
| Immigrants | Kuwait | 93.3 /100 | #98 | Exceptional 5.1% |
Demographics Similar to Pennsylvania Germans by Male Unemployment
In terms of male unemployment, the demographic groups most similar to Pennsylvania Germans are European (4.8%, a difference of 0.050%), English (4.8%, a difference of 0.080%), Immigrants from Taiwan (4.8%, a difference of 0.16%), Carpatho Rusyn (4.8%, a difference of 0.18%), and Tongan (4.8%, a difference of 0.22%).
| Demographics | Rating | Rank | Male Unemployment |
| Bolivians | 100.0 /100 | #13 | Exceptional 4.7% |
| Germans | 100.0 /100 | #14 | Exceptional 4.7% |
| Scandinavians | 100.0 /100 | #15 | Exceptional 4.7% |
| Swiss | 99.9 /100 | #16 | Exceptional 4.7% |
| Filipinos | 99.9 /100 | #17 | Exceptional 4.7% |
| English | 99.9 /100 | #18 | Exceptional 4.8% |
| Europeans | 99.9 /100 | #19 | Exceptional 4.8% |
| Pennsylvania Germans | 99.9 /100 | #20 | Exceptional 4.8% |
| Immigrants | Taiwan | 99.9 /100 | #21 | Exceptional 4.8% |
| Carpatho Rusyns | 99.9 /100 | #22 | Exceptional 4.8% |
| Tongans | 99.9 /100 | #23 | Exceptional 4.8% |
| Immigrants | South Central Asia | 99.9 /100 | #24 | Exceptional 4.8% |
| Zimbabweans | 99.9 /100 | #25 | Exceptional 4.8% |
| Dutch | 99.9 /100 | #26 | Exceptional 4.8% |
| Belgians | 99.9 /100 | #27 | Exceptional 4.8% |