Central American Indian vs Immigrants from Serbia Male Unemployment
COMPARE
Central American Indian
Immigrants from Serbia
Male Unemployment
Male Unemployment Comparison
Central American Indians
Immigrants from Serbia
6.3%
MALE UNEMPLOYMENT
0.0/ 100
METRIC RATING
287th/ 347
METRIC RANK
5.1%
MALE UNEMPLOYMENT
94.2/ 100
METRIC RATING
93rd/ 347
METRIC RANK
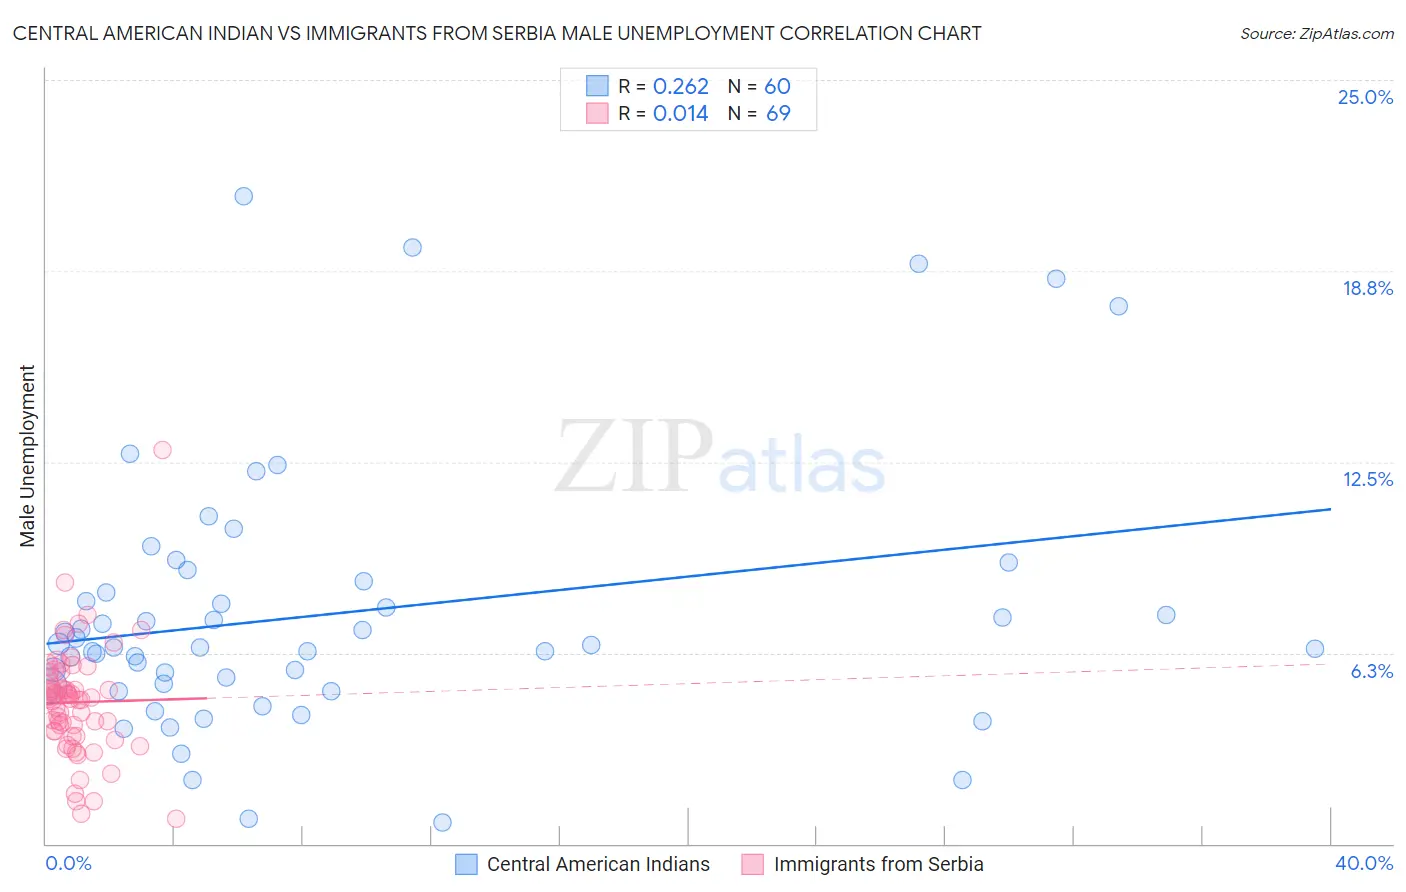
Central American Indian vs Immigrants from Serbia Male Unemployment Correlation Chart
The statistical analysis conducted on geographies consisting of 325,394,182 people shows a weak positive correlation between the proportion of Central American Indians and unemployment rate among males in the United States with a correlation coefficient (R) of 0.262 and weighted average of 6.3%. Similarly, the statistical analysis conducted on geographies consisting of 131,612,227 people shows no correlation between the proportion of Immigrants from Serbia and unemployment rate among males in the United States with a correlation coefficient (R) of 0.014 and weighted average of 5.1%, a difference of 23.5%.
Male Unemployment Correlation Summary
| Measurement | Central American Indian | Immigrants from Serbia |
| Minimum | 0.70% | 0.80% |
| Maximum | 21.2% | 12.9% |
| Range | 20.5% | 12.1% |
| Mean | 7.5% | 4.6% |
| Median | 6.5% | 4.8% |
| Interquartile 25% (IQ1) | 5.2% | 3.6% |
| Interquartile 75% (IQ3) | 8.4% | 5.5% |
| Interquartile Range (IQR) | 3.2% | 1.9% |
| Standard Deviation (Sample) | 4.3% | 1.8% |
| Standard Deviation (Population) | 4.3% | 1.8% |
Similar Demographics by Male Unemployment
Demographics Similar to Central American Indians by Male Unemployment
In terms of male unemployment, the demographic groups most similar to Central American Indians are Immigrants from Senegal (6.3%, a difference of 0.040%), Immigrants from Caribbean (6.3%, a difference of 0.16%), African (6.3%, a difference of 0.29%), Immigrants from Ecuador (6.2%, a difference of 0.72%), and Spanish American Indian (6.2%, a difference of 0.74%).
| Demographics | Rating | Rank | Male Unemployment |
| Immigrants | Ghana | 0.0 /100 | #280 | Tragic 6.2% |
| Sierra Leoneans | 0.0 /100 | #281 | Tragic 6.2% |
| Ecuadorians | 0.0 /100 | #282 | Tragic 6.2% |
| Immigrants | Western Africa | 0.0 /100 | #283 | Tragic 6.2% |
| Spanish American Indians | 0.0 /100 | #284 | Tragic 6.2% |
| Immigrants | Ecuador | 0.0 /100 | #285 | Tragic 6.2% |
| Africans | 0.0 /100 | #286 | Tragic 6.3% |
| Central American Indians | 0.0 /100 | #287 | Tragic 6.3% |
| Immigrants | Senegal | 0.0 /100 | #288 | Tragic 6.3% |
| Immigrants | Caribbean | 0.0 /100 | #289 | Tragic 6.3% |
| U.S. Virgin Islanders | 0.0 /100 | #290 | Tragic 6.4% |
| Immigrants | Azores | 0.0 /100 | #291 | Tragic 6.4% |
| Nepalese | 0.0 /100 | #292 | Tragic 6.4% |
| Haitians | 0.0 /100 | #293 | Tragic 6.4% |
| Senegalese | 0.0 /100 | #294 | Tragic 6.4% |
Demographics Similar to Immigrants from Serbia by Male Unemployment
In terms of male unemployment, the demographic groups most similar to Immigrants from Serbia are Slavic (5.1%, a difference of 0.0%), Canadian (5.1%, a difference of 0.050%), Immigrants from Turkey (5.1%, a difference of 0.060%), Italian (5.1%, a difference of 0.12%), and Okinawan (5.1%, a difference of 0.14%).
| Demographics | Rating | Rank | Male Unemployment |
| Maltese | 95.5 /100 | #86 | Exceptional 5.1% |
| Immigrants | Romania | 95.4 /100 | #87 | Exceptional 5.1% |
| Immigrants | Sri Lanka | 94.9 /100 | #88 | Exceptional 5.1% |
| Immigrants | Australia | 94.7 /100 | #89 | Exceptional 5.1% |
| Okinawans | 94.7 /100 | #90 | Exceptional 5.1% |
| Immigrants | Turkey | 94.4 /100 | #91 | Exceptional 5.1% |
| Slavs | 94.2 /100 | #92 | Exceptional 5.1% |
| Immigrants | Serbia | 94.2 /100 | #93 | Exceptional 5.1% |
| Canadians | 94.1 /100 | #94 | Exceptional 5.1% |
| Italians | 93.8 /100 | #95 | Exceptional 5.1% |
| Asians | 93.7 /100 | #96 | Exceptional 5.1% |
| Immigrants | Spain | 93.4 /100 | #97 | Exceptional 5.1% |
| Immigrants | Kuwait | 93.3 /100 | #98 | Exceptional 5.1% |
| Uruguayans | 93.0 /100 | #99 | Exceptional 5.1% |
| Russians | 92.9 /100 | #100 | Exceptional 5.1% |