Celtic vs Shoshone Unemployment Among Ages 65 to 74 years
COMPARE
Celtic
Shoshone
Unemployment Among Ages 65 to 74 years
Unemployment Among Ages 65 to 74 years Comparison
Celtics
Shoshone
5.3%
UNEMPLOYMENT AMONG AGES 65 TO 74 YEARS
80.8/ 100
METRIC RATING
136th/ 347
METRIC RANK
6.2%
UNEMPLOYMENT AMONG AGES 65 TO 74 YEARS
0.0/ 100
METRIC RATING
327th/ 347
METRIC RANK
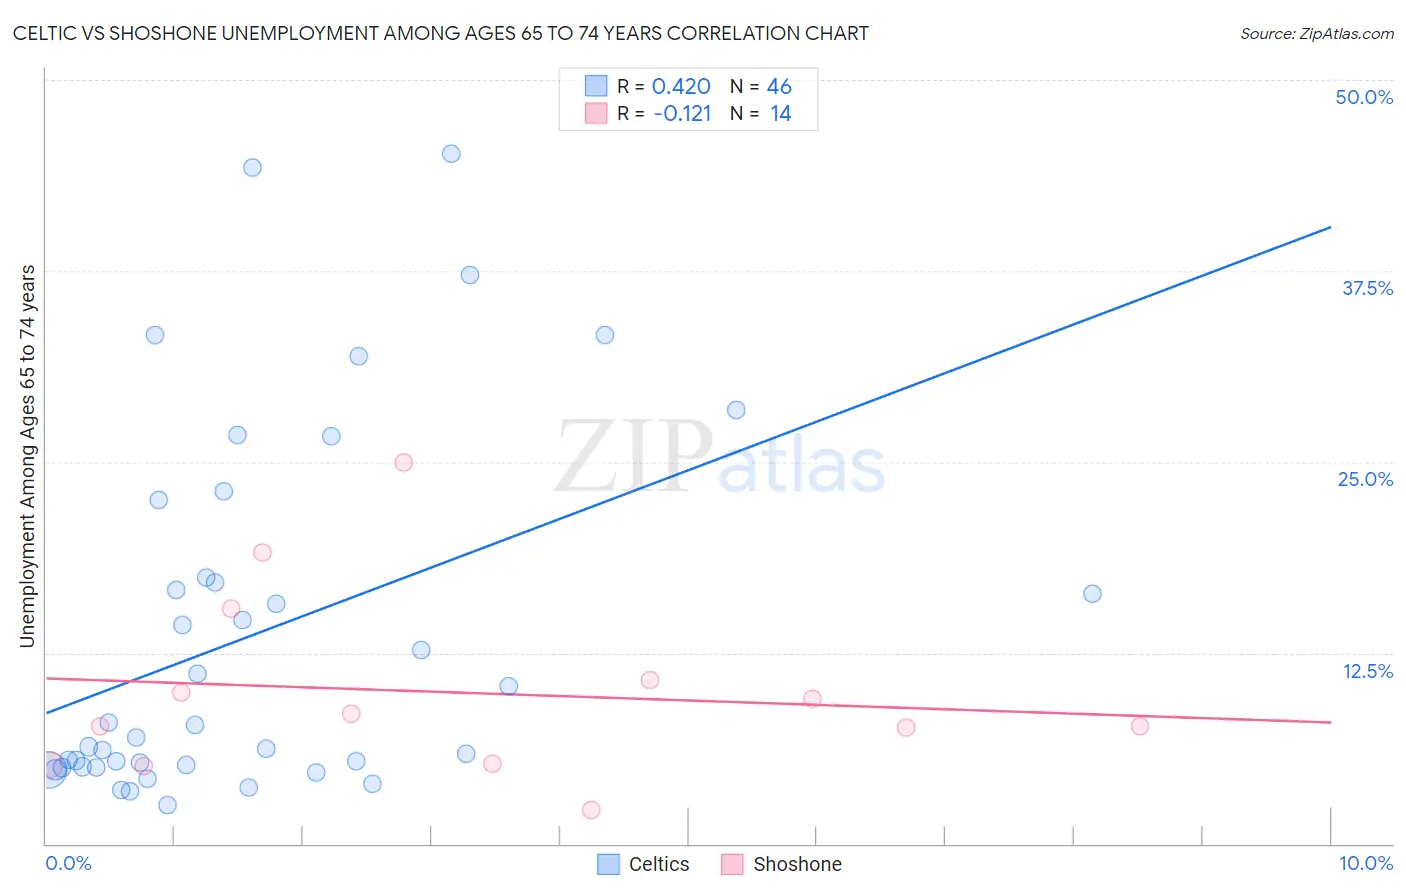
Celtic vs Shoshone Unemployment Among Ages 65 to 74 years Correlation Chart
The statistical analysis conducted on geographies consisting of 155,250,318 people shows a moderate positive correlation between the proportion of Celtics and unemployment rate among population between the ages 65 and 74 in the United States with a correlation coefficient (R) of 0.420 and weighted average of 5.3%. Similarly, the statistical analysis conducted on geographies consisting of 63,179,225 people shows a poor negative correlation between the proportion of Shoshone and unemployment rate among population between the ages 65 and 74 in the United States with a correlation coefficient (R) of -0.121 and weighted average of 6.2%, a difference of 17.2%.
Unemployment Among Ages 65 to 74 years Correlation Summary
| Measurement | Celtic | Shoshone |
| Minimum | 2.5% | 2.2% |
| Maximum | 45.2% | 25.0% |
| Range | 42.7% | 22.8% |
| Mean | 13.7% | 9.9% |
| Median | 7.4% | 8.1% |
| Interquartile 25% (IQ1) | 5.0% | 5.2% |
| Interquartile 75% (IQ3) | 17.4% | 10.7% |
| Interquartile Range (IQR) | 12.4% | 5.5% |
| Standard Deviation (Sample) | 11.7% | 6.1% |
| Standard Deviation (Population) | 11.6% | 5.9% |
Similar Demographics by Unemployment Among Ages 65 to 74 years
Demographics Similar to Celtics by Unemployment Among Ages 65 to 74 years
In terms of unemployment among ages 65 to 74 years, the demographic groups most similar to Celtics are Immigrants from Afghanistan (5.3%, a difference of 0.0%), Immigrants from Serbia (5.3%, a difference of 0.050%), Immigrants from Panama (5.3%, a difference of 0.060%), Chilean (5.3%, a difference of 0.060%), and Ukrainian (5.3%, a difference of 0.070%).
| Demographics | Rating | Rank | Unemployment Among Ages 65 to 74 years |
| Immigrants | England | 86.2 /100 | #129 | Excellent 5.3% |
| Eastern Europeans | 85.6 /100 | #130 | Excellent 5.3% |
| Immigrants | Russia | 83.0 /100 | #131 | Excellent 5.3% |
| Koreans | 82.6 /100 | #132 | Excellent 5.3% |
| Ukrainians | 82.0 /100 | #133 | Excellent 5.3% |
| Immigrants | Panama | 81.8 /100 | #134 | Excellent 5.3% |
| Immigrants | Serbia | 81.8 /100 | #135 | Excellent 5.3% |
| Celtics | 80.8 /100 | #136 | Excellent 5.3% |
| Immigrants | Afghanistan | 80.8 /100 | #137 | Excellent 5.3% |
| Chileans | 79.7 /100 | #138 | Good 5.3% |
| Finns | 79.0 /100 | #139 | Good 5.3% |
| Immigrants | Laos | 78.6 /100 | #140 | Good 5.3% |
| Immigrants | Asia | 78.4 /100 | #141 | Good 5.3% |
| Turks | 76.2 /100 | #142 | Good 5.3% |
| New Zealanders | 76.1 /100 | #143 | Good 5.3% |
Demographics Similar to Shoshone by Unemployment Among Ages 65 to 74 years
In terms of unemployment among ages 65 to 74 years, the demographic groups most similar to Shoshone are Immigrants from the Azores (6.2%, a difference of 0.17%), Yuman (6.2%, a difference of 0.52%), Dominican (6.3%, a difference of 0.82%), Bermudan (6.3%, a difference of 0.97%), and Immigrants from Dominican Republic (6.3%, a difference of 1.3%).
| Demographics | Rating | Rank | Unemployment Among Ages 65 to 74 years |
| Immigrants | Bahamas | 0.0 /100 | #320 | Tragic 5.9% |
| Immigrants | Dominica | 0.0 /100 | #321 | Tragic 6.0% |
| Immigrants | Mexico | 0.0 /100 | #322 | Tragic 6.0% |
| Delaware | 0.0 /100 | #323 | Tragic 6.0% |
| Tohono O'odham | 0.0 /100 | #324 | Tragic 6.0% |
| Immigrants | Portugal | 0.0 /100 | #325 | Tragic 6.0% |
| Natives/Alaskans | 0.0 /100 | #326 | Tragic 6.0% |
| Shoshone | 0.0 /100 | #327 | Tragic 6.2% |
| Immigrants | Azores | 0.0 /100 | #328 | Tragic 6.2% |
| Yuman | 0.0 /100 | #329 | Tragic 6.2% |
| Dominicans | 0.0 /100 | #330 | Tragic 6.3% |
| Bermudans | 0.0 /100 | #331 | Tragic 6.3% |
| Immigrants | Dominican Republic | 0.0 /100 | #332 | Tragic 6.3% |
| Paiute | 0.0 /100 | #333 | Tragic 6.3% |
| Taiwanese | 0.0 /100 | #334 | Tragic 6.3% |