Celtic vs Chilean Unemployment Among Ages 65 to 74 years
COMPARE
Celtic
Chilean
Unemployment Among Ages 65 to 74 years
Unemployment Among Ages 65 to 74 years Comparison
Celtics
Chileans
5.3%
UNEMPLOYMENT AMONG AGES 65 TO 74 YEARS
80.8/ 100
METRIC RATING
136th/ 347
METRIC RANK
5.3%
UNEMPLOYMENT AMONG AGES 65 TO 74 YEARS
79.7/ 100
METRIC RATING
138th/ 347
METRIC RANK
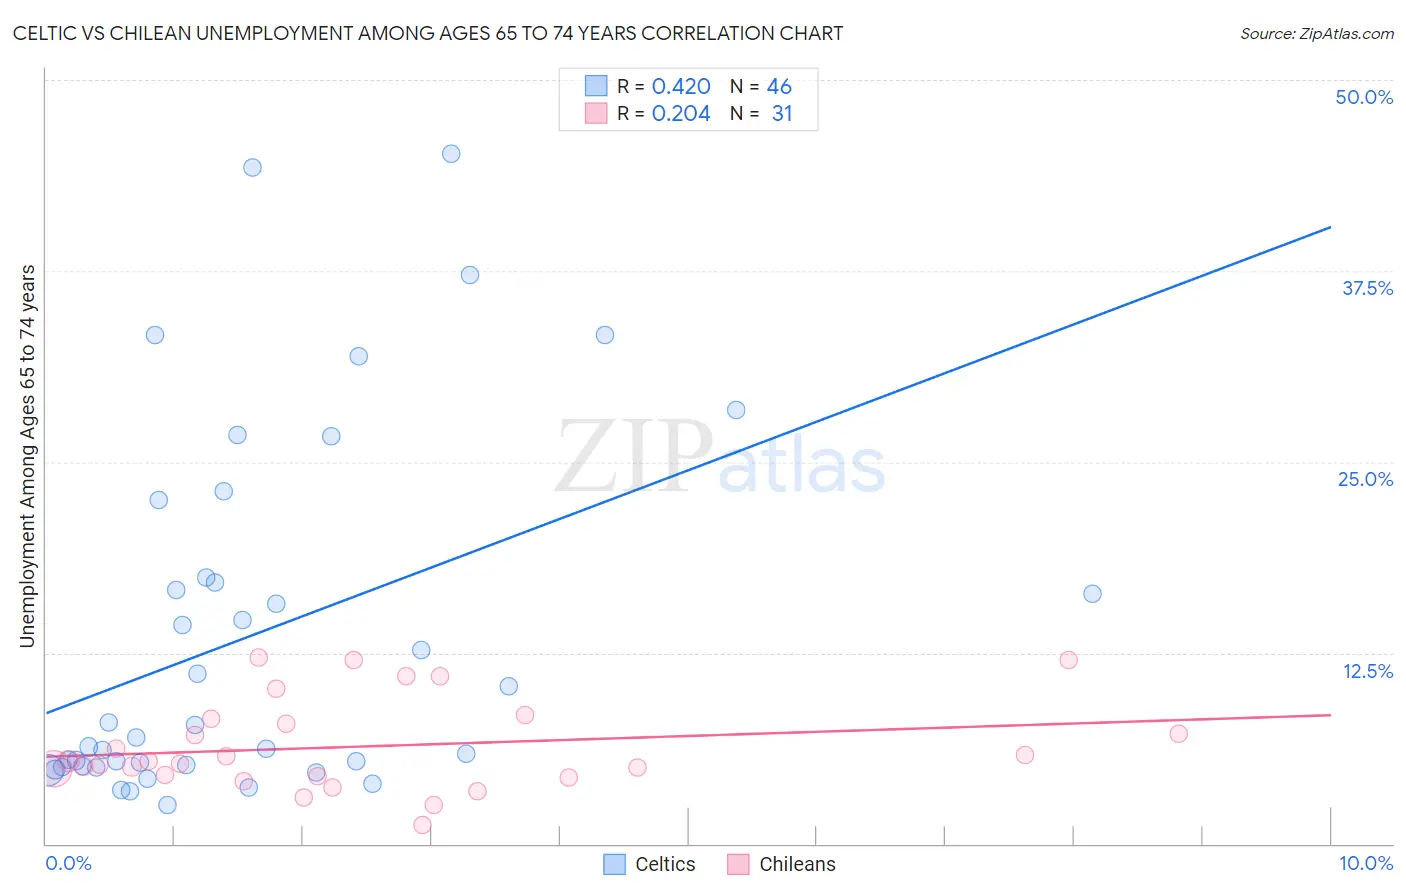
Celtic vs Chilean Unemployment Among Ages 65 to 74 years Correlation Chart
The statistical analysis conducted on geographies consisting of 155,250,318 people shows a moderate positive correlation between the proportion of Celtics and unemployment rate among population between the ages 65 and 74 in the United States with a correlation coefficient (R) of 0.420 and weighted average of 5.3%. Similarly, the statistical analysis conducted on geographies consisting of 238,435,211 people shows a weak positive correlation between the proportion of Chileans and unemployment rate among population between the ages 65 and 74 in the United States with a correlation coefficient (R) of 0.204 and weighted average of 5.3%, a difference of 0.060%.
Unemployment Among Ages 65 to 74 years Correlation Summary
| Measurement | Celtic | Chilean |
| Minimum | 2.5% | 1.2% |
| Maximum | 45.2% | 12.2% |
| Range | 42.7% | 11.0% |
| Mean | 13.7% | 6.4% |
| Median | 7.4% | 5.4% |
| Interquartile 25% (IQ1) | 5.0% | 4.4% |
| Interquartile 75% (IQ3) | 17.4% | 8.2% |
| Interquartile Range (IQR) | 12.4% | 3.8% |
| Standard Deviation (Sample) | 11.7% | 3.0% |
| Standard Deviation (Population) | 11.6% | 2.9% |
Demographics Similar to Celtics and Chileans by Unemployment Among Ages 65 to 74 years
In terms of unemployment among ages 65 to 74 years, the demographic groups most similar to Celtics are Immigrants from Afghanistan (5.3%, a difference of 0.0%), Immigrants from Serbia (5.3%, a difference of 0.050%), Immigrants from Panama (5.3%, a difference of 0.060%), Ukrainian (5.3%, a difference of 0.070%), and Korean (5.3%, a difference of 0.10%). Similarly, the demographic groups most similar to Chileans are Finnish (5.3%, a difference of 0.040%), Immigrants from Afghanistan (5.3%, a difference of 0.060%), Immigrants from Laos (5.3%, a difference of 0.060%), Immigrants from Asia (5.3%, a difference of 0.070%), and Immigrants from Serbia (5.3%, a difference of 0.11%).
| Demographics | Rating | Rank | Unemployment Among Ages 65 to 74 years |
| Immigrants | North America | 86.7 /100 | #127 | Excellent 5.3% |
| Immigrants | Hong Kong | 86.5 /100 | #128 | Excellent 5.3% |
| Immigrants | England | 86.2 /100 | #129 | Excellent 5.3% |
| Eastern Europeans | 85.6 /100 | #130 | Excellent 5.3% |
| Immigrants | Russia | 83.0 /100 | #131 | Excellent 5.3% |
| Koreans | 82.6 /100 | #132 | Excellent 5.3% |
| Ukrainians | 82.0 /100 | #133 | Excellent 5.3% |
| Immigrants | Panama | 81.8 /100 | #134 | Excellent 5.3% |
| Immigrants | Serbia | 81.8 /100 | #135 | Excellent 5.3% |
| Celtics | 80.8 /100 | #136 | Excellent 5.3% |
| Immigrants | Afghanistan | 80.8 /100 | #137 | Excellent 5.3% |
| Chileans | 79.7 /100 | #138 | Good 5.3% |
| Finns | 79.0 /100 | #139 | Good 5.3% |
| Immigrants | Laos | 78.6 /100 | #140 | Good 5.3% |
| Immigrants | Asia | 78.4 /100 | #141 | Good 5.3% |
| Turks | 76.2 /100 | #142 | Good 5.3% |
| New Zealanders | 76.1 /100 | #143 | Good 5.3% |
| Immigrants | Chile | 76.0 /100 | #144 | Good 5.3% |
| Canadians | 75.0 /100 | #145 | Good 5.3% |
| Irish | 74.8 /100 | #146 | Good 5.3% |
| Immigrants | Latvia | 74.6 /100 | #147 | Good 5.3% |