Celtic vs Egyptian Unemployment Among Women with Children Under 6 years
COMPARE
Celtic
Egyptian
Unemployment Among Women with Children Under 6 years
Unemployment Among Women with Children Under 6 years Comparison
Celtics
Egyptians
8.3%
UNEMPLOYMENT AMONG WOMEN WITH CHILDREN UNDER 6 YEARS
0.6/ 100
METRIC RATING
256th/ 347
METRIC RANK
7.1%
UNEMPLOYMENT AMONG WOMEN WITH CHILDREN UNDER 6 YEARS
98.7/ 100
METRIC RATING
83rd/ 347
METRIC RANK
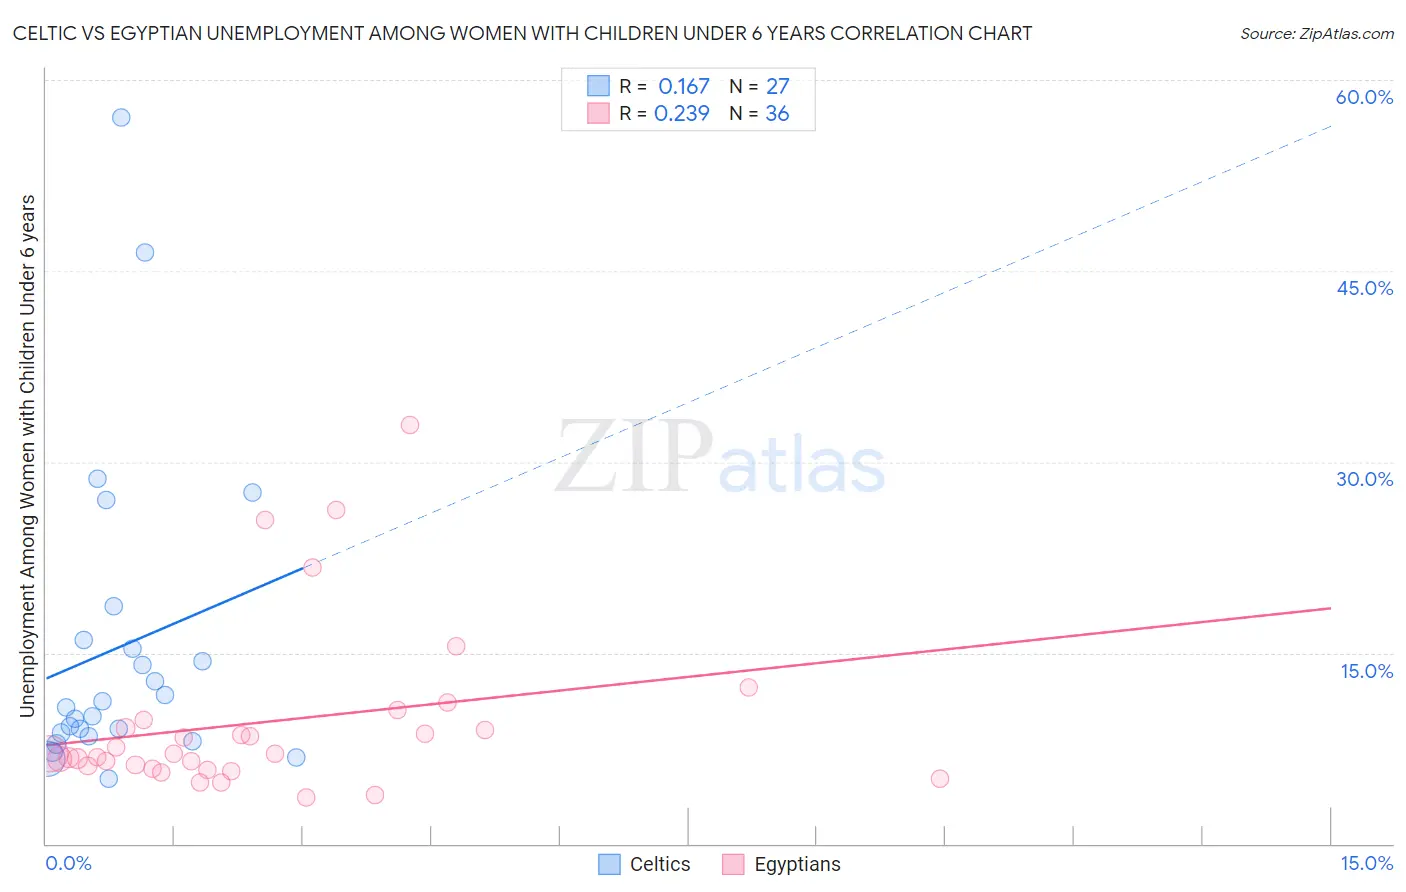
Celtic vs Egyptian Unemployment Among Women with Children Under 6 years Correlation Chart
The statistical analysis conducted on geographies consisting of 142,115,013 people shows a poor positive correlation between the proportion of Celtics and unemployment rate among women with children under the age of 6 in the United States with a correlation coefficient (R) of 0.167 and weighted average of 8.3%. Similarly, the statistical analysis conducted on geographies consisting of 225,958,031 people shows a weak positive correlation between the proportion of Egyptians and unemployment rate among women with children under the age of 6 in the United States with a correlation coefficient (R) of 0.239 and weighted average of 7.1%, a difference of 16.9%.
Unemployment Among Women with Children Under 6 years Correlation Summary
| Measurement | Celtic | Egyptian |
| Minimum | 5.1% | 3.7% |
| Maximum | 57.1% | 32.9% |
| Range | 52.0% | 29.2% |
| Mean | 15.5% | 9.5% |
| Median | 10.7% | 7.0% |
| Interquartile 25% (IQ1) | 8.5% | 6.0% |
| Interquartile 75% (IQ3) | 16.0% | 9.4% |
| Interquartile Range (IQR) | 7.5% | 3.4% |
| Standard Deviation (Sample) | 12.3% | 6.7% |
| Standard Deviation (Population) | 12.1% | 6.6% |
Similar Demographics by Unemployment Among Women with Children Under 6 years
Demographics Similar to Celtics by Unemployment Among Women with Children Under 6 years
In terms of unemployment among women with children under 6 years, the demographic groups most similar to Celtics are Immigrants from Portugal (8.3%, a difference of 0.020%), British West Indian (8.3%, a difference of 0.26%), Immigrants from Ghana (8.3%, a difference of 0.28%), Immigrants from Caribbean (8.3%, a difference of 0.31%), and Immigrants from Guyana (8.2%, a difference of 0.57%).
| Demographics | Rating | Rank | Unemployment Among Women with Children Under 6 years |
| Immigrants | Sierra Leone | 1.1 /100 | #249 | Tragic 8.2% |
| Nigerians | 1.1 /100 | #250 | Tragic 8.2% |
| Guyanese | 1.0 /100 | #251 | Tragic 8.2% |
| Ghanaians | 1.0 /100 | #252 | Tragic 8.2% |
| Immigrants | Guyana | 0.8 /100 | #253 | Tragic 8.2% |
| Immigrants | Caribbean | 0.7 /100 | #254 | Tragic 8.3% |
| Immigrants | Portugal | 0.6 /100 | #255 | Tragic 8.3% |
| Celtics | 0.6 /100 | #256 | Tragic 8.3% |
| British West Indians | 0.5 /100 | #257 | Tragic 8.3% |
| Immigrants | Ghana | 0.5 /100 | #258 | Tragic 8.3% |
| Barbadians | 0.4 /100 | #259 | Tragic 8.3% |
| Whites/Caucasians | 0.3 /100 | #260 | Tragic 8.4% |
| Immigrants | Liberia | 0.3 /100 | #261 | Tragic 8.4% |
| West Indians | 0.3 /100 | #262 | Tragic 8.4% |
| Scotch-Irish | 0.3 /100 | #263 | Tragic 8.4% |
Demographics Similar to Egyptians by Unemployment Among Women with Children Under 6 years
In terms of unemployment among women with children under 6 years, the demographic groups most similar to Egyptians are Immigrants from Afghanistan (7.1%, a difference of 0.030%), Immigrants from Albania (7.1%, a difference of 0.050%), Immigrants from Romania (7.1%, a difference of 0.090%), Immigrants from Venezuela (7.1%, a difference of 0.18%), and Immigrants from Zimbabwe (7.1%, a difference of 0.21%).
| Demographics | Rating | Rank | Unemployment Among Women with Children Under 6 years |
| Estonians | 99.0 /100 | #76 | Exceptional 7.1% |
| Immigrants | Croatia | 98.9 /100 | #77 | Exceptional 7.1% |
| Immigrants | Somalia | 98.9 /100 | #78 | Exceptional 7.1% |
| Immigrants | Fiji | 98.9 /100 | #79 | Exceptional 7.1% |
| Immigrants | Greece | 98.9 /100 | #80 | Exceptional 7.1% |
| Immigrants | Venezuela | 98.8 /100 | #81 | Exceptional 7.1% |
| Immigrants | Afghanistan | 98.7 /100 | #82 | Exceptional 7.1% |
| Egyptians | 98.7 /100 | #83 | Exceptional 7.1% |
| Immigrants | Albania | 98.7 /100 | #84 | Exceptional 7.1% |
| Immigrants | Romania | 98.7 /100 | #85 | Exceptional 7.1% |
| Immigrants | Zimbabwe | 98.6 /100 | #86 | Exceptional 7.1% |
| Alsatians | 98.4 /100 | #87 | Exceptional 7.1% |
| Immigrants | Hungary | 98.3 /100 | #88 | Exceptional 7.1% |
| Immigrants | Denmark | 98.3 /100 | #89 | Exceptional 7.1% |
| Immigrants | Spain | 98.2 /100 | #90 | Exceptional 7.1% |