Celtic vs Creek Unemployment Among Women with Children Under 6 years
COMPARE
Celtic
Creek
Unemployment Among Women with Children Under 6 years
Unemployment Among Women with Children Under 6 years Comparison
Celtics
Creek
8.3%
UNEMPLOYMENT AMONG WOMEN WITH CHILDREN UNDER 6 YEARS
0.6/ 100
METRIC RATING
256th/ 347
METRIC RANK
8.9%
UNEMPLOYMENT AMONG WOMEN WITH CHILDREN UNDER 6 YEARS
0.0/ 100
METRIC RATING
300th/ 347
METRIC RANK
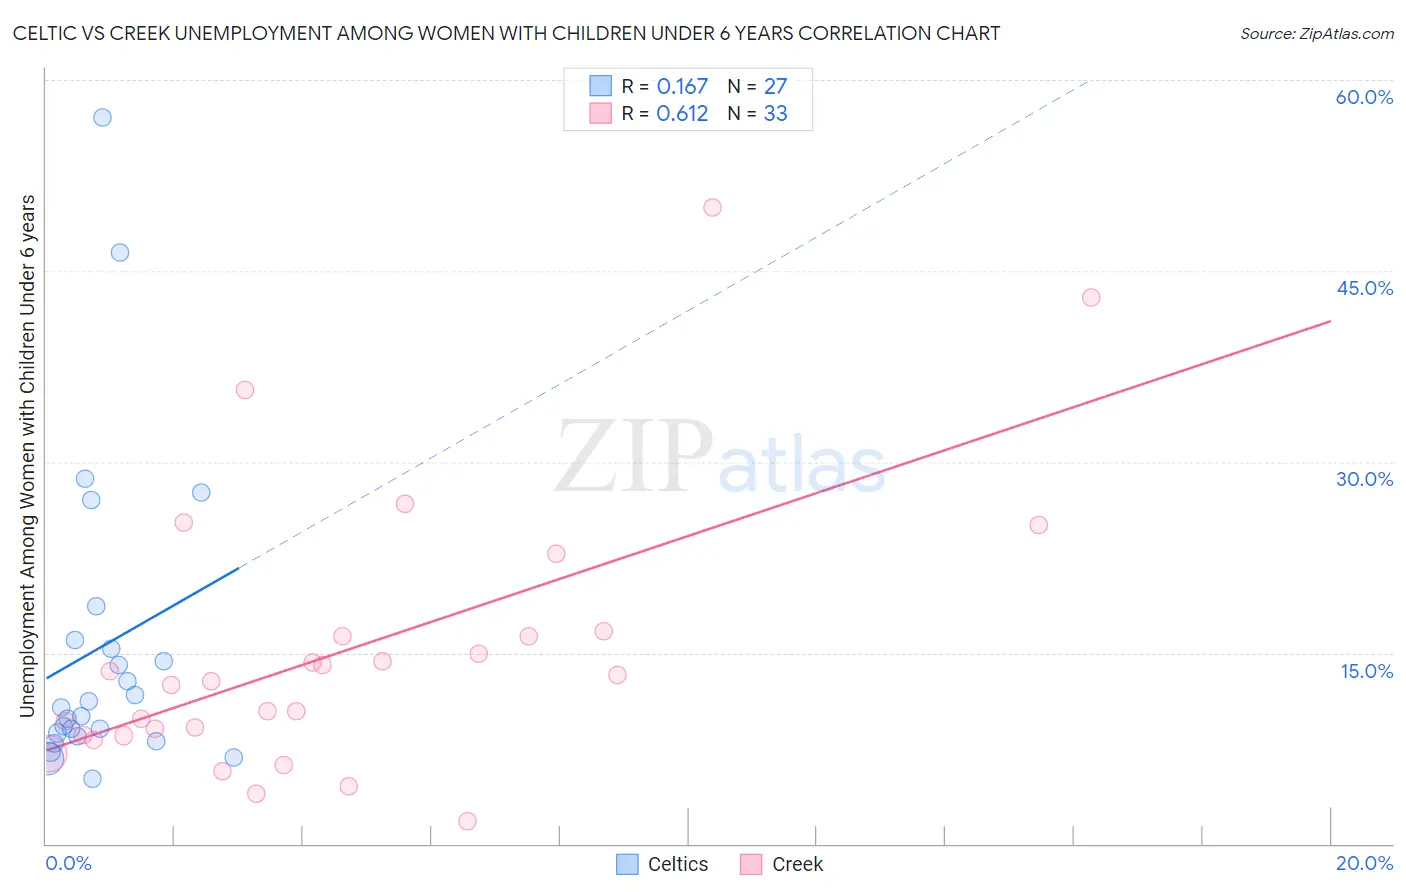
Celtic vs Creek Unemployment Among Women with Children Under 6 years Correlation Chart
The statistical analysis conducted on geographies consisting of 142,115,013 people shows a poor positive correlation between the proportion of Celtics and unemployment rate among women with children under the age of 6 in the United States with a correlation coefficient (R) of 0.167 and weighted average of 8.3%. Similarly, the statistical analysis conducted on geographies consisting of 152,329,999 people shows a significant positive correlation between the proportion of Creek and unemployment rate among women with children under the age of 6 in the United States with a correlation coefficient (R) of 0.612 and weighted average of 8.9%, a difference of 7.5%.
Unemployment Among Women with Children Under 6 years Correlation Summary
| Measurement | Celtic | Creek |
| Minimum | 5.1% | 1.8% |
| Maximum | 57.1% | 50.0% |
| Range | 52.0% | 48.2% |
| Mean | 15.5% | 15.1% |
| Median | 10.7% | 12.8% |
| Interquartile 25% (IQ1) | 8.5% | 8.5% |
| Interquartile 75% (IQ3) | 16.0% | 16.5% |
| Interquartile Range (IQR) | 7.5% | 8.0% |
| Standard Deviation (Sample) | 12.3% | 10.9% |
| Standard Deviation (Population) | 12.1% | 10.7% |
Similar Demographics by Unemployment Among Women with Children Under 6 years
Demographics Similar to Celtics by Unemployment Among Women with Children Under 6 years
In terms of unemployment among women with children under 6 years, the demographic groups most similar to Celtics are Immigrants from Portugal (8.3%, a difference of 0.020%), British West Indian (8.3%, a difference of 0.26%), Immigrants from Ghana (8.3%, a difference of 0.28%), Immigrants from Caribbean (8.3%, a difference of 0.31%), and Immigrants from Guyana (8.2%, a difference of 0.57%).
| Demographics | Rating | Rank | Unemployment Among Women with Children Under 6 years |
| Immigrants | Sierra Leone | 1.1 /100 | #249 | Tragic 8.2% |
| Nigerians | 1.1 /100 | #250 | Tragic 8.2% |
| Guyanese | 1.0 /100 | #251 | Tragic 8.2% |
| Ghanaians | 1.0 /100 | #252 | Tragic 8.2% |
| Immigrants | Guyana | 0.8 /100 | #253 | Tragic 8.2% |
| Immigrants | Caribbean | 0.7 /100 | #254 | Tragic 8.3% |
| Immigrants | Portugal | 0.6 /100 | #255 | Tragic 8.3% |
| Celtics | 0.6 /100 | #256 | Tragic 8.3% |
| British West Indians | 0.5 /100 | #257 | Tragic 8.3% |
| Immigrants | Ghana | 0.5 /100 | #258 | Tragic 8.3% |
| Barbadians | 0.4 /100 | #259 | Tragic 8.3% |
| Whites/Caucasians | 0.3 /100 | #260 | Tragic 8.4% |
| Immigrants | Liberia | 0.3 /100 | #261 | Tragic 8.4% |
| West Indians | 0.3 /100 | #262 | Tragic 8.4% |
| Scotch-Irish | 0.3 /100 | #263 | Tragic 8.4% |
Demographics Similar to Creek by Unemployment Among Women with Children Under 6 years
In terms of unemployment among women with children under 6 years, the demographic groups most similar to Creek are Immigrants from Jamaica (8.9%, a difference of 0.090%), Tlingit-Haida (8.9%, a difference of 0.30%), Mexican (8.9%, a difference of 0.46%), Chickasaw (9.0%, a difference of 0.53%), and Immigrants from Dominican Republic (8.9%, a difference of 0.55%).
| Demographics | Rating | Rank | Unemployment Among Women with Children Under 6 years |
| Immigrants | Bangladesh | 0.0 /100 | #293 | Tragic 8.8% |
| Immigrants | Nonimmigrants | 0.0 /100 | #294 | Tragic 8.8% |
| Immigrants | Central America | 0.0 /100 | #295 | Tragic 8.9% |
| Immigrants | Dominican Republic | 0.0 /100 | #296 | Tragic 8.9% |
| Mexicans | 0.0 /100 | #297 | Tragic 8.9% |
| Tlingit-Haida | 0.0 /100 | #298 | Tragic 8.9% |
| Immigrants | Jamaica | 0.0 /100 | #299 | Tragic 8.9% |
| Creek | 0.0 /100 | #300 | Tragic 8.9% |
| Chickasaw | 0.0 /100 | #301 | Tragic 9.0% |
| Hispanics or Latinos | 0.0 /100 | #302 | Tragic 9.0% |
| Immigrants | West Indies | 0.0 /100 | #303 | Tragic 9.0% |
| Immigrants | Mexico | 0.0 /100 | #304 | Tragic 9.1% |
| Alaskan Athabascans | 0.0 /100 | #305 | Tragic 9.1% |
| Pueblo | 0.0 /100 | #306 | Tragic 9.1% |
| Dominicans | 0.0 /100 | #307 | Tragic 9.1% |