Lumbee vs Immigrants from Barbados Unemployment Among Seniors over 65 years
COMPARE
Lumbee
Immigrants from Barbados
Unemployment Among Seniors over 65 years
Unemployment Among Seniors over 65 years Comparison
Lumbee
Immigrants from Barbados
4.6%
UNEMPLOYMENT AMONG SENIORS OVER 65 YEARS
100.0/ 100
METRIC RATING
15th/ 347
METRIC RANK
5.5%
UNEMPLOYMENT AMONG SENIORS OVER 65 YEARS
0.0/ 100
METRIC RATING
286th/ 347
METRIC RANK
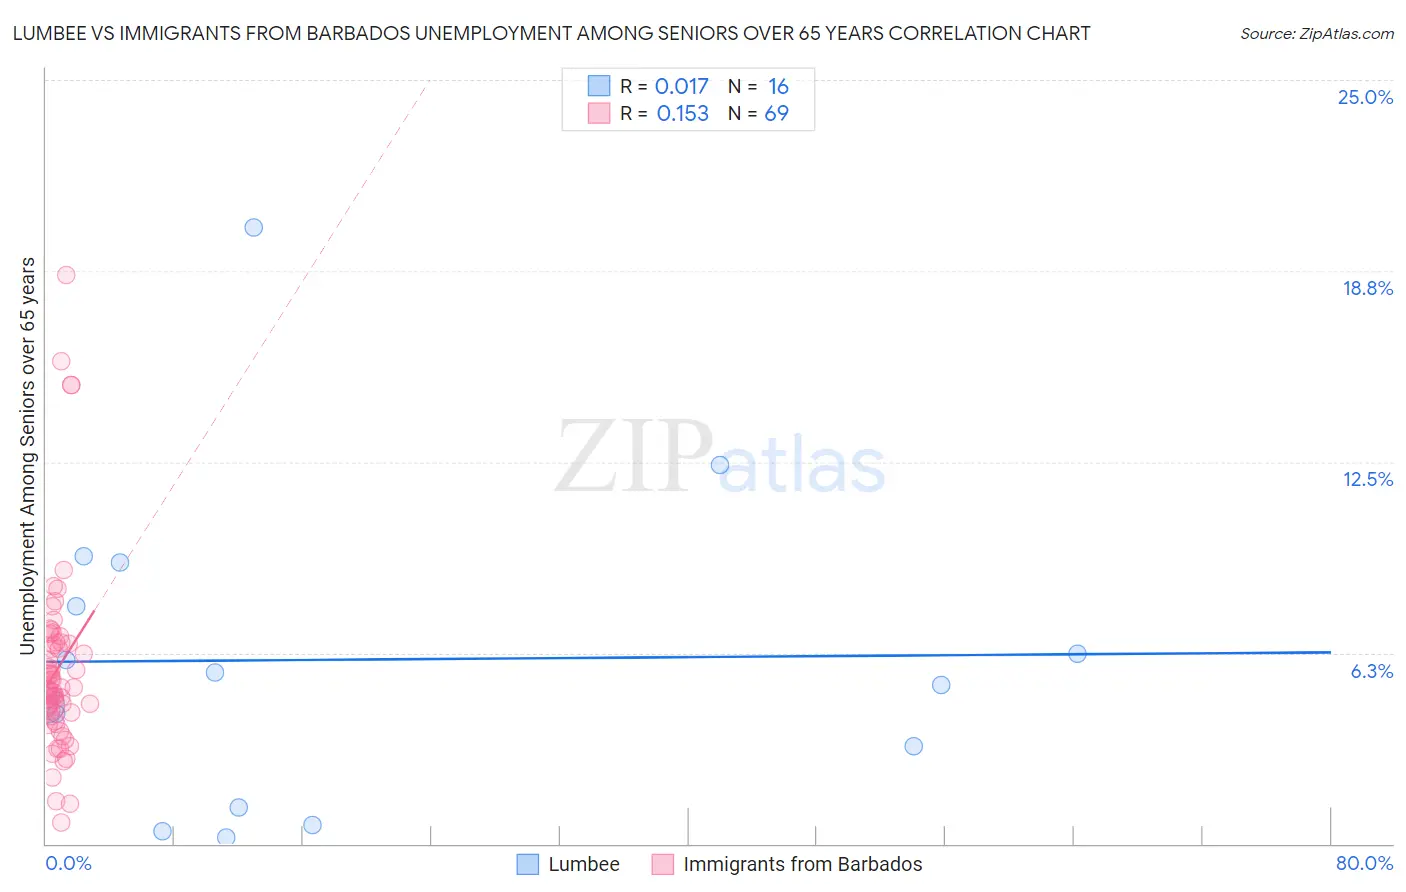
Lumbee vs Immigrants from Barbados Unemployment Among Seniors over 65 years Correlation Chart
The statistical analysis conducted on geographies consisting of 86,768,453 people shows no correlation between the proportion of Lumbee and unemployment rate amomg seniors over the age of 65 in the United States with a correlation coefficient (R) of 0.017 and weighted average of 4.6%. Similarly, the statistical analysis conducted on geographies consisting of 109,022,444 people shows a poor positive correlation between the proportion of Immigrants from Barbados and unemployment rate amomg seniors over the age of 65 in the United States with a correlation coefficient (R) of 0.153 and weighted average of 5.5%, a difference of 18.7%.
Unemployment Among Seniors over 65 years Correlation Summary
| Measurement | Lumbee | Immigrants from Barbados |
| Minimum | 0.20% | 0.70% |
| Maximum | 20.2% | 18.6% |
| Range | 20.0% | 17.9% |
| Mean | 6.0% | 5.7% |
| Median | 5.4% | 5.1% |
| Interquartile 25% (IQ1) | 2.2% | 4.2% |
| Interquartile 75% (IQ3) | 8.5% | 6.6% |
| Interquartile Range (IQR) | 6.3% | 2.3% |
| Standard Deviation (Sample) | 5.2% | 3.1% |
| Standard Deviation (Population) | 5.0% | 3.1% |
Similar Demographics by Unemployment Among Seniors over 65 years
Demographics Similar to Lumbee by Unemployment Among Seniors over 65 years
In terms of unemployment among seniors over 65 years, the demographic groups most similar to Lumbee are Immigrants from Burma/Myanmar (4.6%, a difference of 0.010%), Menominee (4.6%, a difference of 0.080%), Creek (4.6%, a difference of 0.11%), Immigrants from Eritrea (4.7%, a difference of 0.41%), and Cuban (4.6%, a difference of 0.52%).
| Demographics | Rating | Rank | Unemployment Among Seniors over 65 years |
| Tsimshian | 100.0 /100 | #8 | Exceptional 4.5% |
| Indonesians | 100.0 /100 | #9 | Exceptional 4.5% |
| Immigrants | Zaire | 100.0 /100 | #10 | Exceptional 4.5% |
| Comanche | 100.0 /100 | #11 | Exceptional 4.6% |
| Osage | 100.0 /100 | #12 | Exceptional 4.6% |
| Cubans | 100.0 /100 | #13 | Exceptional 4.6% |
| Menominee | 100.0 /100 | #14 | Exceptional 4.6% |
| Lumbee | 100.0 /100 | #15 | Exceptional 4.6% |
| Immigrants | Burma/Myanmar | 100.0 /100 | #16 | Exceptional 4.6% |
| Creek | 100.0 /100 | #17 | Exceptional 4.6% |
| Immigrants | Eritrea | 100.0 /100 | #18 | Exceptional 4.7% |
| Lebanese | 100.0 /100 | #19 | Exceptional 4.7% |
| Immigrants | Nepal | 100.0 /100 | #20 | Exceptional 4.7% |
| Norwegians | 100.0 /100 | #21 | Exceptional 4.7% |
| Czechs | 100.0 /100 | #22 | Exceptional 4.7% |
Demographics Similar to Immigrants from Barbados by Unemployment Among Seniors over 65 years
In terms of unemployment among seniors over 65 years, the demographic groups most similar to Immigrants from Barbados are Central American (5.5%, a difference of 0.030%), Venezuelan (5.5%, a difference of 0.030%), U.S. Virgin Islander (5.5%, a difference of 0.030%), Immigrants from Cabo Verde (5.5%, a difference of 0.060%), and Immigrants from Liberia (5.5%, a difference of 0.080%).
| Demographics | Rating | Rank | Unemployment Among Seniors over 65 years |
| Brazilians | 0.1 /100 | #279 | Tragic 5.5% |
| Immigrants | South America | 0.1 /100 | #280 | Tragic 5.5% |
| Immigrants | Norway | 0.0 /100 | #281 | Tragic 5.5% |
| Immigrants | Belize | 0.0 /100 | #282 | Tragic 5.5% |
| Immigrants | Haiti | 0.0 /100 | #283 | Tragic 5.5% |
| Immigrants | Liberia | 0.0 /100 | #284 | Tragic 5.5% |
| Central Americans | 0.0 /100 | #285 | Tragic 5.5% |
| Immigrants | Barbados | 0.0 /100 | #286 | Tragic 5.5% |
| Venezuelans | 0.0 /100 | #287 | Tragic 5.5% |
| U.S. Virgin Islanders | 0.0 /100 | #288 | Tragic 5.5% |
| Immigrants | Cabo Verde | 0.0 /100 | #289 | Tragic 5.5% |
| Jamaicans | 0.0 /100 | #290 | Tragic 5.5% |
| Blacks/African Americans | 0.0 /100 | #291 | Tragic 5.5% |
| Belizeans | 0.0 /100 | #292 | Tragic 5.5% |
| Immigrants | Venezuela | 0.0 /100 | #293 | Tragic 5.5% |