Chippewa vs Immigrants from Barbados Unemployment Among Seniors over 65 years
COMPARE
Chippewa
Immigrants from Barbados
Unemployment Among Seniors over 65 years
Unemployment Among Seniors over 65 years Comparison
Chippewa
Immigrants from Barbados
5.4%
UNEMPLOYMENT AMONG SENIORS OVER 65 YEARS
0.2/ 100
METRIC RATING
267th/ 347
METRIC RANK
5.5%
UNEMPLOYMENT AMONG SENIORS OVER 65 YEARS
0.0/ 100
METRIC RATING
286th/ 347
METRIC RANK
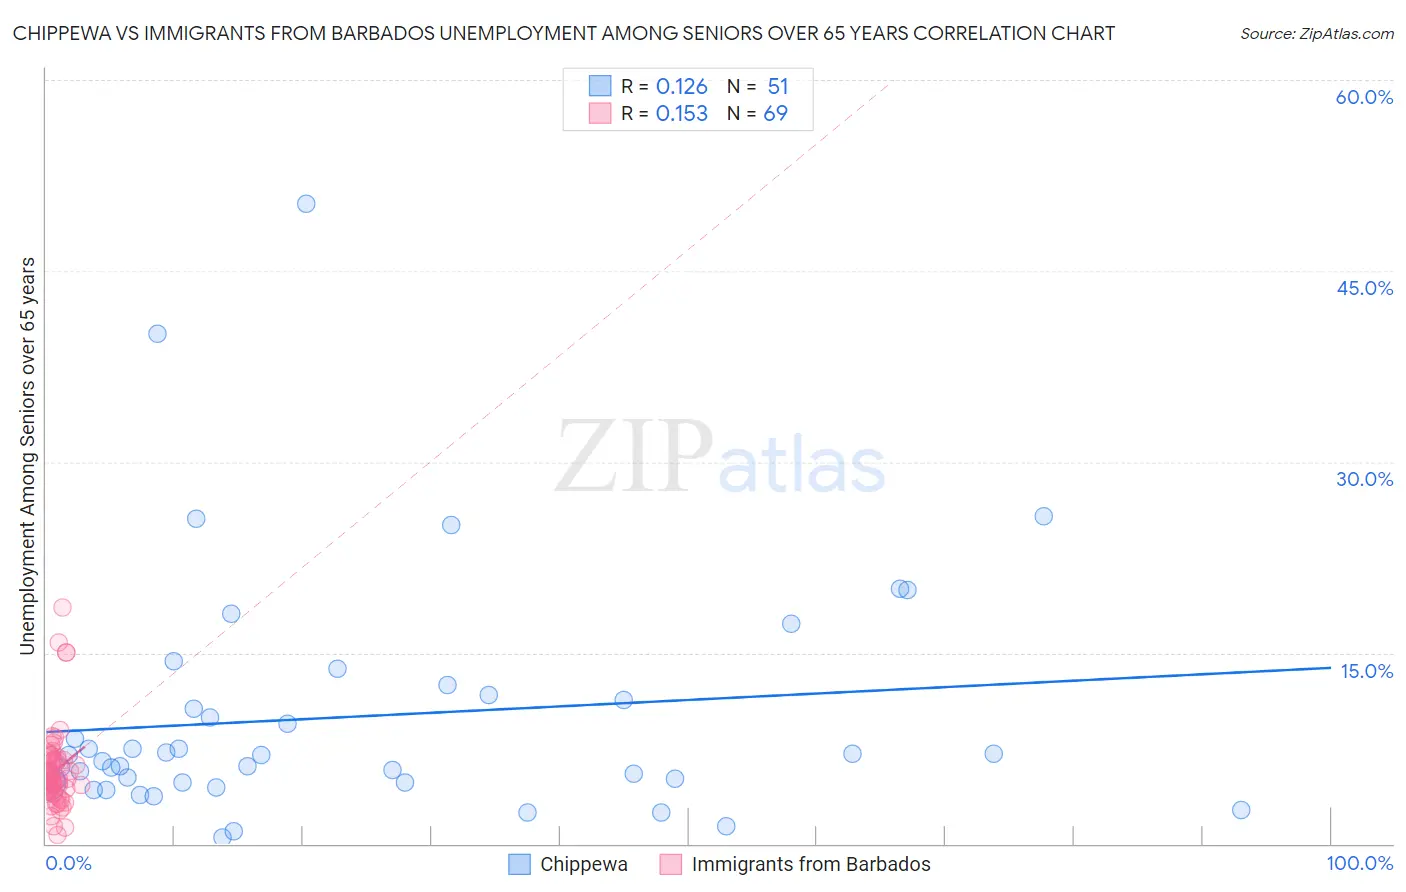
Chippewa vs Immigrants from Barbados Unemployment Among Seniors over 65 years Correlation Chart
The statistical analysis conducted on geographies consisting of 194,992,138 people shows a poor positive correlation between the proportion of Chippewa and unemployment rate amomg seniors over the age of 65 in the United States with a correlation coefficient (R) of 0.126 and weighted average of 5.4%. Similarly, the statistical analysis conducted on geographies consisting of 109,022,444 people shows a poor positive correlation between the proportion of Immigrants from Barbados and unemployment rate amomg seniors over the age of 65 in the United States with a correlation coefficient (R) of 0.153 and weighted average of 5.5%, a difference of 1.7%.
Unemployment Among Seniors over 65 years Correlation Summary
| Measurement | Chippewa | Immigrants from Barbados |
| Minimum | 0.50% | 0.70% |
| Maximum | 50.3% | 18.6% |
| Range | 49.8% | 17.9% |
| Mean | 10.0% | 5.7% |
| Median | 7.0% | 5.1% |
| Interquartile 25% (IQ1) | 4.8% | 4.2% |
| Interquartile 75% (IQ3) | 11.7% | 6.6% |
| Interquartile Range (IQR) | 6.9% | 2.3% |
| Standard Deviation (Sample) | 9.5% | 3.1% |
| Standard Deviation (Population) | 9.4% | 3.1% |
Demographics Similar to Chippewa and Immigrants from Barbados by Unemployment Among Seniors over 65 years
In terms of unemployment among seniors over 65 years, the demographic groups most similar to Chippewa are Pennsylvania German (5.4%, a difference of 0.0%), Hawaiian (5.4%, a difference of 0.10%), Immigrants from Southern Europe (5.4%, a difference of 0.24%), Immigrants from Morocco (5.4%, a difference of 0.31%), and Cypriot (5.4%, a difference of 0.32%). Similarly, the demographic groups most similar to Immigrants from Barbados are Central American (5.5%, a difference of 0.030%), Immigrants from Liberia (5.5%, a difference of 0.080%), Immigrants from Haiti (5.5%, a difference of 0.40%), Immigrants from Belize (5.5%, a difference of 0.59%), and Immigrants from Norway (5.5%, a difference of 0.72%).
| Demographics | Rating | Rank | Unemployment Among Seniors over 65 years |
| Pennsylvania Germans | 0.2 /100 | #266 | Tragic 5.4% |
| Chippewa | 0.2 /100 | #267 | Tragic 5.4% |
| Hawaiians | 0.1 /100 | #268 | Tragic 5.4% |
| Immigrants | Southern Europe | 0.1 /100 | #269 | Tragic 5.4% |
| Immigrants | Morocco | 0.1 /100 | #270 | Tragic 5.4% |
| Cypriots | 0.1 /100 | #271 | Tragic 5.4% |
| Immigrants | Jamaica | 0.1 /100 | #272 | Tragic 5.4% |
| Immigrants | Nigeria | 0.1 /100 | #273 | Tragic 5.4% |
| Immigrants | Brazil | 0.1 /100 | #274 | Tragic 5.4% |
| Mexican American Indians | 0.1 /100 | #275 | Tragic 5.4% |
| Pueblo | 0.1 /100 | #276 | Tragic 5.4% |
| Immigrants | Western Africa | 0.1 /100 | #277 | Tragic 5.4% |
| Colville | 0.1 /100 | #278 | Tragic 5.4% |
| Brazilians | 0.1 /100 | #279 | Tragic 5.5% |
| Immigrants | South America | 0.1 /100 | #280 | Tragic 5.5% |
| Immigrants | Norway | 0.0 /100 | #281 | Tragic 5.5% |
| Immigrants | Belize | 0.0 /100 | #282 | Tragic 5.5% |
| Immigrants | Haiti | 0.0 /100 | #283 | Tragic 5.5% |
| Immigrants | Liberia | 0.0 /100 | #284 | Tragic 5.5% |
| Central Americans | 0.0 /100 | #285 | Tragic 5.5% |
| Immigrants | Barbados | 0.0 /100 | #286 | Tragic 5.5% |