Celtic vs Immigrants from Greece Unemployment Among Ages 20 to 24 years
COMPARE
Celtic
Immigrants from Greece
Unemployment Among Ages 20 to 24 years
Unemployment Among Ages 20 to 24 years Comparison
Celtics
Immigrants from Greece
9.9%
UNEMPLOYMENT AMONG AGES 20 TO 24 YEARS
98.9/ 100
METRIC RATING
71st/ 347
METRIC RANK
11.1%
UNEMPLOYMENT AMONG AGES 20 TO 24 YEARS
0.0/ 100
METRIC RATING
267th/ 347
METRIC RANK
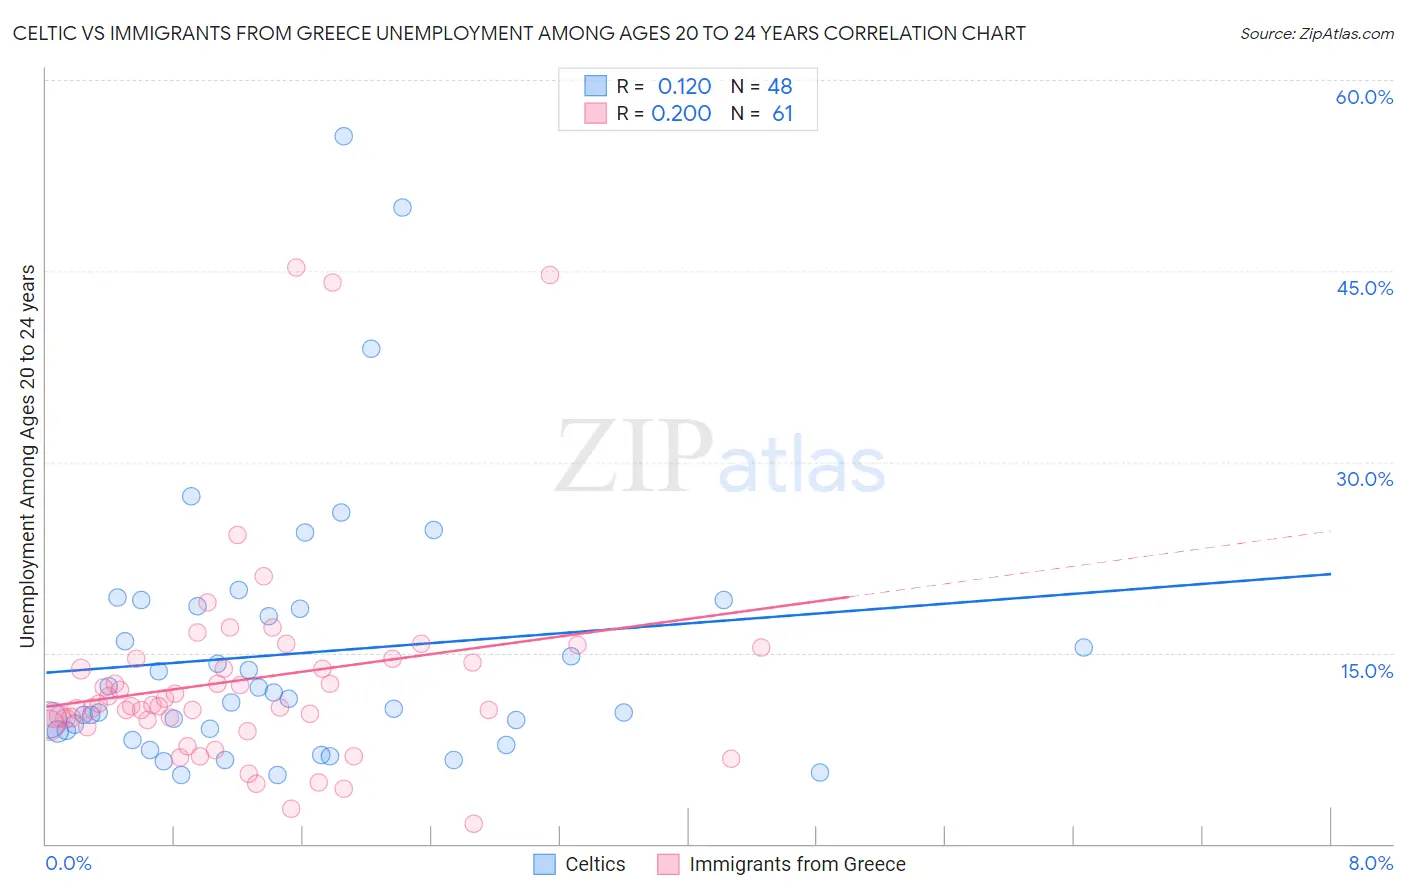
Celtic vs Immigrants from Greece Unemployment Among Ages 20 to 24 years Correlation Chart
The statistical analysis conducted on geographies consisting of 165,509,552 people shows a poor positive correlation between the proportion of Celtics and unemployment rate among population between the ages 20 and 24 in the United States with a correlation coefficient (R) of 0.120 and weighted average of 9.9%. Similarly, the statistical analysis conducted on geographies consisting of 212,977,174 people shows a weak positive correlation between the proportion of Immigrants from Greece and unemployment rate among population between the ages 20 and 24 in the United States with a correlation coefficient (R) of 0.200 and weighted average of 11.1%, a difference of 12.6%.
Unemployment Among Ages 20 to 24 years Correlation Summary
| Measurement | Celtic | Immigrants from Greece |
| Minimum | 5.4% | 1.6% |
| Maximum | 55.6% | 45.3% |
| Range | 50.2% | 43.7% |
| Mean | 14.9% | 12.9% |
| Median | 11.3% | 10.8% |
| Interquartile 25% (IQ1) | 8.8% | 9.5% |
| Interquartile 75% (IQ3) | 18.6% | 14.3% |
| Interquartile Range (IQR) | 9.7% | 4.9% |
| Standard Deviation (Sample) | 10.5% | 8.4% |
| Standard Deviation (Population) | 10.4% | 8.3% |
Similar Demographics by Unemployment Among Ages 20 to 24 years
Demographics Similar to Celtics by Unemployment Among Ages 20 to 24 years
In terms of unemployment among ages 20 to 24 years, the demographic groups most similar to Celtics are Immigrants from Croatia (9.9%, a difference of 0.030%), Bolivian (9.9%, a difference of 0.040%), Bulgarian (9.9%, a difference of 0.15%), Kenyan (9.9%, a difference of 0.18%), and Immigrants from Laos (9.9%, a difference of 0.21%).
| Demographics | Rating | Rank | Unemployment Among Ages 20 to 24 years |
| Serbians | 99.4 /100 | #64 | Exceptional 9.8% |
| Welsh | 99.3 /100 | #65 | Exceptional 9.8% |
| Scottish | 99.3 /100 | #66 | Exceptional 9.8% |
| Immigrants | Bolivia | 99.2 /100 | #67 | Exceptional 9.9% |
| Mongolians | 99.1 /100 | #68 | Exceptional 9.9% |
| Bulgarians | 99.1 /100 | #69 | Exceptional 9.9% |
| Immigrants | Croatia | 99.0 /100 | #70 | Exceptional 9.9% |
| Celtics | 98.9 /100 | #71 | Exceptional 9.9% |
| Bolivians | 98.9 /100 | #72 | Exceptional 9.9% |
| Kenyans | 98.7 /100 | #73 | Exceptional 9.9% |
| Immigrants | Laos | 98.7 /100 | #74 | Exceptional 9.9% |
| Immigrants | Australia | 98.6 /100 | #75 | Exceptional 9.9% |
| Czechoslovakians | 98.4 /100 | #76 | Exceptional 9.9% |
| Chickasaw | 98.4 /100 | #77 | Exceptional 9.9% |
| Assyrians/Chaldeans/Syriacs | 98.3 /100 | #78 | Exceptional 9.9% |
Demographics Similar to Immigrants from Greece by Unemployment Among Ages 20 to 24 years
In terms of unemployment among ages 20 to 24 years, the demographic groups most similar to Immigrants from Greece are Immigrants from Liberia (11.1%, a difference of 0.28%), Immigrants from Ireland (11.1%, a difference of 0.37%), Subsaharan African (11.1%, a difference of 0.44%), Maltese (11.2%, a difference of 0.44%), and Ute (11.2%, a difference of 0.83%).
| Demographics | Rating | Rank | Unemployment Among Ages 20 to 24 years |
| Immigrants | Lebanon | 0.2 /100 | #260 | Tragic 10.9% |
| Puget Sound Salish | 0.2 /100 | #261 | Tragic 10.9% |
| Immigrants | Latin America | 0.1 /100 | #262 | Tragic 11.0% |
| Marshallese | 0.1 /100 | #263 | Tragic 11.0% |
| Sub-Saharan Africans | 0.0 /100 | #264 | Tragic 11.1% |
| Immigrants | Ireland | 0.0 /100 | #265 | Tragic 11.1% |
| Immigrants | Liberia | 0.0 /100 | #266 | Tragic 11.1% |
| Immigrants | Greece | 0.0 /100 | #267 | Tragic 11.1% |
| Maltese | 0.0 /100 | #268 | Tragic 11.2% |
| Ute | 0.0 /100 | #269 | Tragic 11.2% |
| Delaware | 0.0 /100 | #270 | Tragic 11.3% |
| Immigrants | Uzbekistan | 0.0 /100 | #271 | Tragic 11.4% |
| Nigerians | 0.0 /100 | #272 | Tragic 11.4% |
| Immigrants | Nigeria | 0.0 /100 | #273 | Tragic 11.5% |
| Cape Verdeans | 0.0 /100 | #274 | Tragic 11.5% |