Carpatho Rusyn vs Immigrants from Ghana Female Unemployment
COMPARE
Carpatho Rusyn
Immigrants from Ghana
Female Unemployment
Female Unemployment Comparison
Carpatho Rusyns
Immigrants from Ghana
4.7%
FEMALE UNEMPLOYMENT
99.9/ 100
METRIC RATING
16th/ 347
METRIC RANK
6.0%
FEMALE UNEMPLOYMENT
0.0/ 100
METRIC RATING
277th/ 347
METRIC RANK
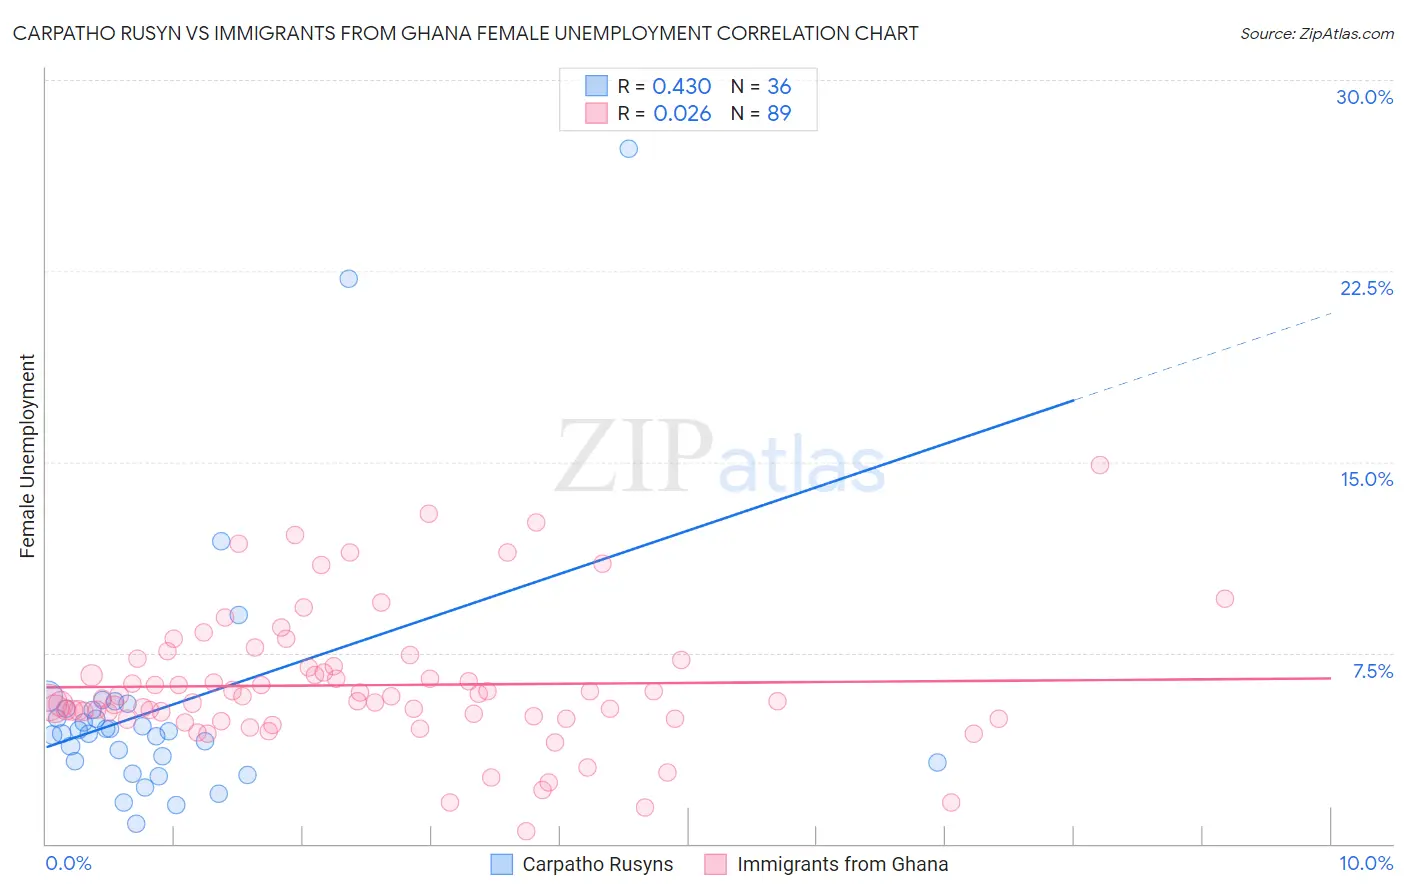
Carpatho Rusyn vs Immigrants from Ghana Female Unemployment Correlation Chart
The statistical analysis conducted on geographies consisting of 58,788,247 people shows a moderate positive correlation between the proportion of Carpatho Rusyns and unemploymnet rate among females in the United States with a correlation coefficient (R) of 0.430 and weighted average of 4.7%. Similarly, the statistical analysis conducted on geographies consisting of 199,631,349 people shows no correlation between the proportion of Immigrants from Ghana and unemploymnet rate among females in the United States with a correlation coefficient (R) of 0.026 and weighted average of 6.0%, a difference of 28.5%.
Female Unemployment Correlation Summary
| Measurement | Carpatho Rusyn | Immigrants from Ghana |
| Minimum | 0.80% | 0.50% |
| Maximum | 27.3% | 14.9% |
| Range | 26.5% | 14.4% |
| Mean | 5.4% | 6.2% |
| Median | 4.4% | 5.7% |
| Interquartile 25% (IQ1) | 3.2% | 4.9% |
| Interquartile 75% (IQ3) | 5.3% | 7.1% |
| Interquartile Range (IQR) | 2.1% | 2.2% |
| Standard Deviation (Sample) | 5.2% | 2.6% |
| Standard Deviation (Population) | 5.1% | 2.6% |
Similar Demographics by Female Unemployment
Demographics Similar to Carpatho Rusyns by Female Unemployment
In terms of female unemployment, the demographic groups most similar to Carpatho Rusyns are Croatian (4.7%, a difference of 0.020%), Latvian (4.7%, a difference of 0.16%), Polish (4.7%, a difference of 0.17%), Bulgarian (4.7%, a difference of 0.25%), and Fijian (4.7%, a difference of 0.27%).
| Demographics | Rating | Rank | Female Unemployment |
| Slovenes | 100.0 /100 | #9 | Exceptional 4.5% |
| Swiss | 100.0 /100 | #10 | Exceptional 4.6% |
| Scandinavians | 100.0 /100 | #11 | Exceptional 4.6% |
| Dutch | 100.0 /100 | #12 | Exceptional 4.6% |
| Belgians | 100.0 /100 | #13 | Exceptional 4.6% |
| Finns | 100.0 /100 | #14 | Exceptional 4.6% |
| English | 100.0 /100 | #15 | Exceptional 4.6% |
| Carpatho Rusyns | 99.9 /100 | #16 | Exceptional 4.7% |
| Croatians | 99.9 /100 | #17 | Exceptional 4.7% |
| Latvians | 99.9 /100 | #18 | Exceptional 4.7% |
| Poles | 99.9 /100 | #19 | Exceptional 4.7% |
| Bulgarians | 99.9 /100 | #20 | Exceptional 4.7% |
| Fijians | 99.9 /100 | #21 | Exceptional 4.7% |
| Europeans | 99.9 /100 | #22 | Exceptional 4.7% |
| Scottish | 99.9 /100 | #23 | Exceptional 4.7% |
Demographics Similar to Immigrants from Ghana by Female Unemployment
In terms of female unemployment, the demographic groups most similar to Immigrants from Ghana are Yaqui (6.0%, a difference of 0.0%), Armenian (6.0%, a difference of 0.12%), Mexican American Indian (6.0%, a difference of 0.17%), Guatemalan (6.0%, a difference of 0.21%), and Bahamian (6.0%, a difference of 0.40%).
| Demographics | Rating | Rank | Female Unemployment |
| Immigrants | Honduras | 0.0 /100 | #270 | Tragic 5.9% |
| Central Americans | 0.0 /100 | #271 | Tragic 5.9% |
| Lumbee | 0.0 /100 | #272 | Tragic 5.9% |
| Ghanaians | 0.0 /100 | #273 | Tragic 5.9% |
| Africans | 0.0 /100 | #274 | Tragic 5.9% |
| Senegalese | 0.0 /100 | #275 | Tragic 6.0% |
| Bahamians | 0.0 /100 | #276 | Tragic 6.0% |
| Immigrants | Ghana | 0.0 /100 | #277 | Tragic 6.0% |
| Yaqui | 0.0 /100 | #278 | Tragic 6.0% |
| Armenians | 0.0 /100 | #279 | Tragic 6.0% |
| Mexican American Indians | 0.0 /100 | #280 | Tragic 6.0% |
| Guatemalans | 0.0 /100 | #281 | Tragic 6.0% |
| Colville | 0.0 /100 | #282 | Tragic 6.0% |
| Salvadorans | 0.0 /100 | #283 | Tragic 6.0% |
| Immigrants | Senegal | 0.0 /100 | #284 | Tragic 6.1% |