Canadian vs Immigrants from North Macedonia Unemployment
COMPARE
Canadian
Immigrants from North Macedonia
Unemployment
Unemployment Comparison
Canadians
Immigrants from North Macedonia
5.0%
UNEMPLOYMENT
97.7/ 100
METRIC RATING
79th/ 347
METRIC RANK
5.0%
UNEMPLOYMENT
96.3/ 100
METRIC RATING
90th/ 347
METRIC RANK
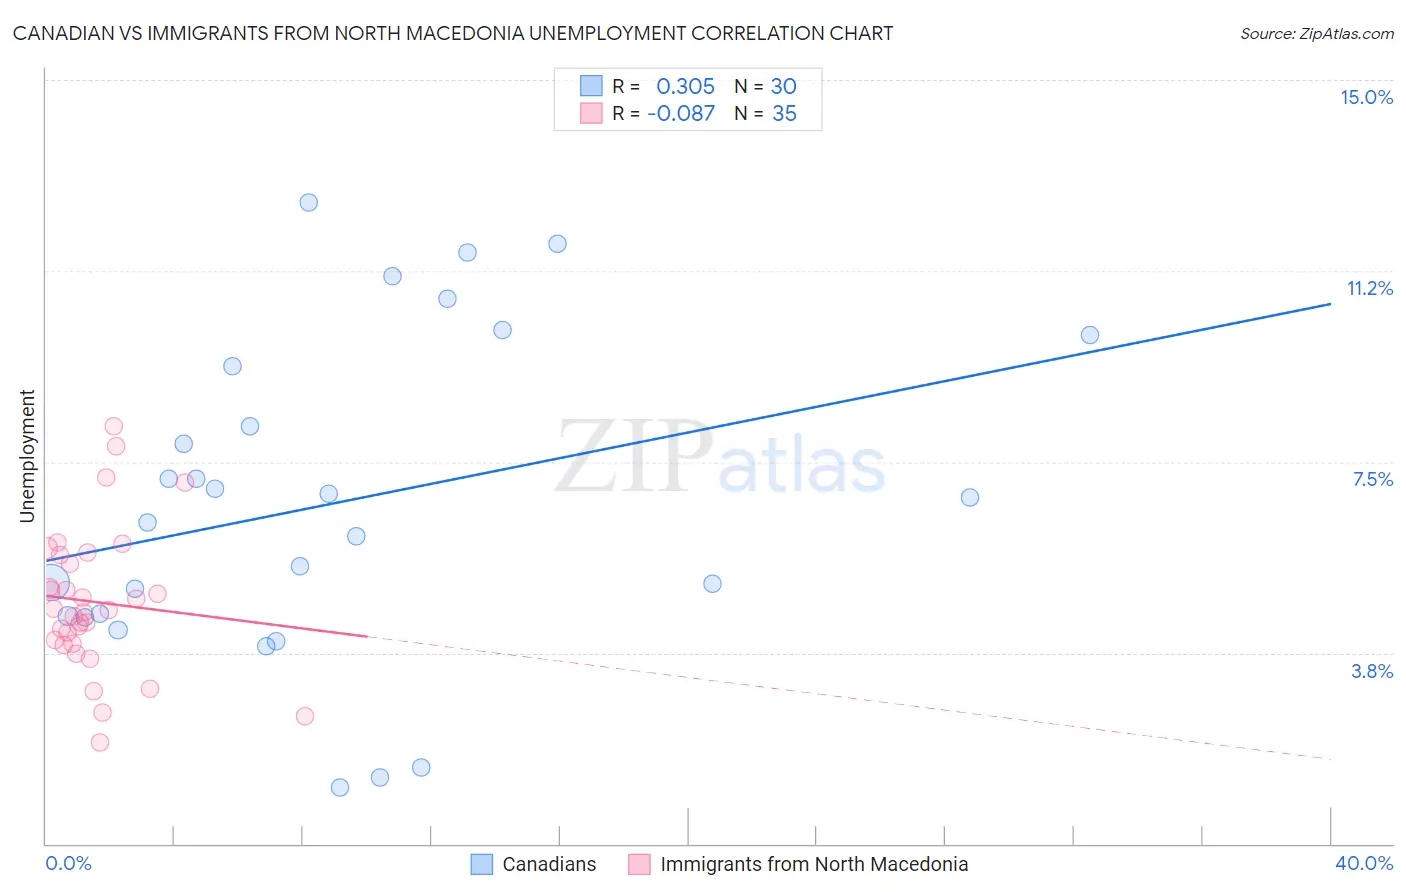
Canadian vs Immigrants from North Macedonia Unemployment Correlation Chart
The statistical analysis conducted on geographies consisting of 436,779,128 people shows a mild positive correlation between the proportion of Canadians and unemployment in the United States with a correlation coefficient (R) of 0.305 and weighted average of 5.0%. Similarly, the statistical analysis conducted on geographies consisting of 74,281,538 people shows a slight negative correlation between the proportion of Immigrants from North Macedonia and unemployment in the United States with a correlation coefficient (R) of -0.087 and weighted average of 5.0%, a difference of 0.80%.
Unemployment Correlation Summary
| Measurement | Canadian | Immigrants from North Macedonia |
| Minimum | 1.1% | 2.0% |
| Maximum | 12.6% | 8.2% |
| Range | 11.5% | 6.2% |
| Mean | 6.7% | 4.7% |
| Median | 6.6% | 4.6% |
| Interquartile 25% (IQ1) | 4.5% | 3.9% |
| Interquartile 75% (IQ3) | 9.4% | 5.7% |
| Interquartile Range (IQR) | 4.9% | 1.8% |
| Standard Deviation (Sample) | 3.2% | 1.4% |
| Standard Deviation (Population) | 3.1% | 1.4% |
Demographics Similar to Canadians and Immigrants from North Macedonia by Unemployment
In terms of unemployment, the demographic groups most similar to Canadians are Immigrants from Sweden (5.0%, a difference of 0.070%), Basque (5.0%, a difference of 0.080%), Fijian (5.0%, a difference of 0.090%), Hmong (5.0%, a difference of 0.10%), and Okinawan (4.9%, a difference of 0.12%). Similarly, the demographic groups most similar to Immigrants from North Macedonia are Immigrants from Sudan (5.0%, a difference of 0.010%), Immigrants from South Africa (5.0%, a difference of 0.030%), Jordanian (5.0%, a difference of 0.040%), Ukrainian (5.0%, a difference of 0.12%), and Immigrants from Korea (5.0%, a difference of 0.13%).
| Demographics | Rating | Rank | Unemployment |
| Immigrants | Northern Europe | 98.2 /100 | #74 | Exceptional 4.9% |
| Turks | 98.0 /100 | #75 | Exceptional 4.9% |
| German Russians | 98.0 /100 | #76 | Exceptional 4.9% |
| Cypriots | 97.9 /100 | #77 | Exceptional 4.9% |
| Okinawans | 97.9 /100 | #78 | Exceptional 4.9% |
| Canadians | 97.7 /100 | #79 | Exceptional 5.0% |
| Immigrants | Sweden | 97.6 /100 | #80 | Exceptional 5.0% |
| Basques | 97.6 /100 | #81 | Exceptional 5.0% |
| Fijians | 97.6 /100 | #82 | Exceptional 5.0% |
| Hmong | 97.6 /100 | #83 | Exceptional 5.0% |
| Russians | 97.4 /100 | #84 | Exceptional 5.0% |
| Immigrants | Australia | 97.0 /100 | #85 | Exceptional 5.0% |
| Hungarians | 96.9 /100 | #86 | Exceptional 5.0% |
| Immigrants | Moldova | 96.6 /100 | #87 | Exceptional 5.0% |
| Immigrants | Korea | 96.6 /100 | #88 | Exceptional 5.0% |
| Jordanians | 96.4 /100 | #89 | Exceptional 5.0% |
| Immigrants | North Macedonia | 96.3 /100 | #90 | Exceptional 5.0% |
| Immigrants | Sudan | 96.3 /100 | #91 | Exceptional 5.0% |
| Immigrants | South Africa | 96.2 /100 | #92 | Exceptional 5.0% |
| Ukrainians | 96.0 /100 | #93 | Exceptional 5.0% |
| Immigrants | Austria | 95.9 /100 | #94 | Exceptional 5.0% |