Apache vs Hawaiian Unemployment
COMPARE
Apache
Hawaiian
Unemployment
Unemployment Comparison
Apache
Hawaiians
7.4%
UNEMPLOYMENT
0.0/ 100
METRIC RATING
334th/ 347
METRIC RANK
5.5%
UNEMPLOYMENT
5.4/ 100
METRIC RATING
229th/ 347
METRIC RANK
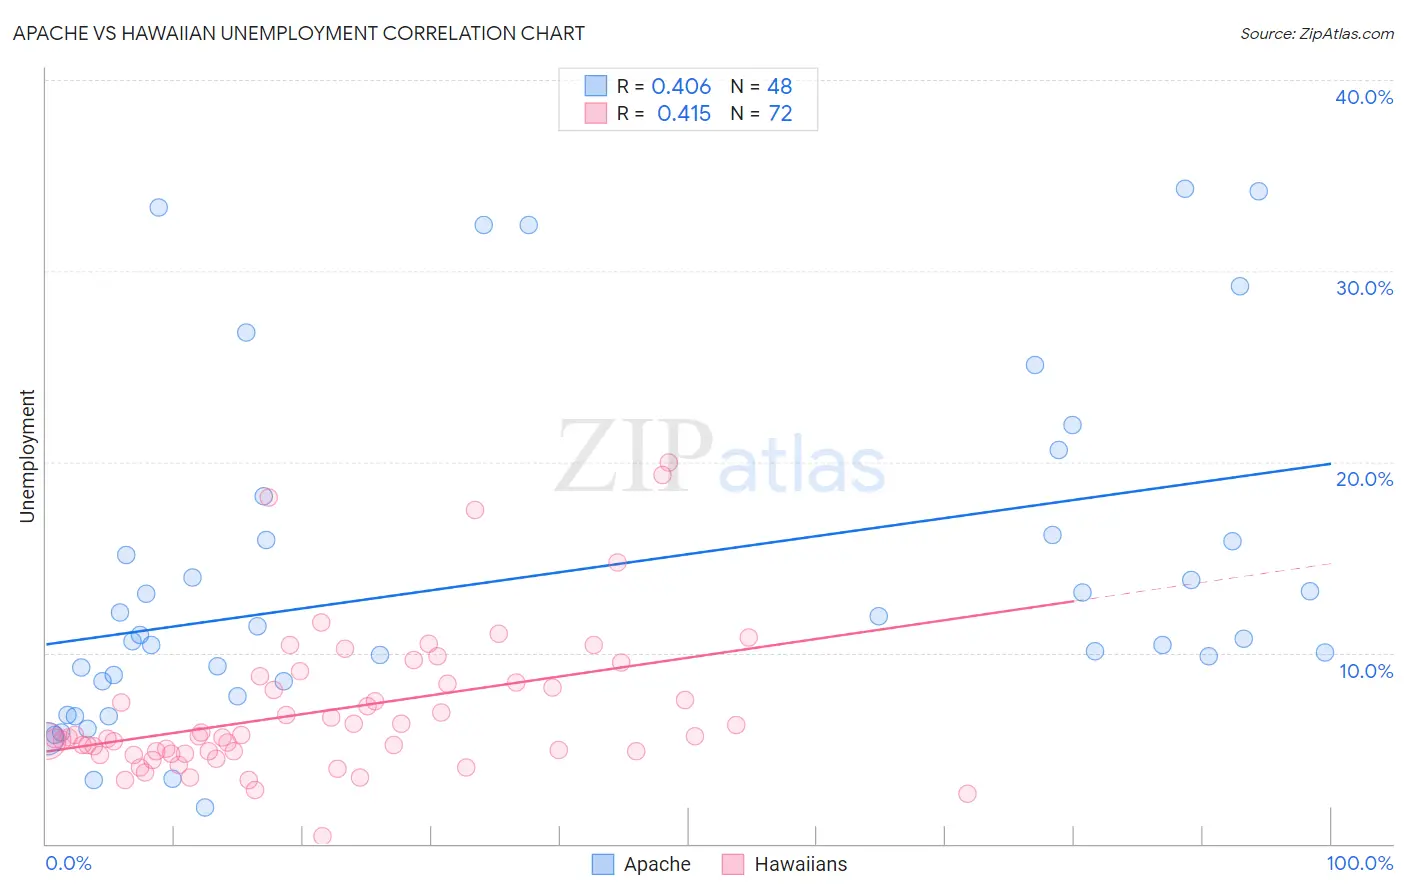
Apache vs Hawaiian Unemployment Correlation Chart
The statistical analysis conducted on geographies consisting of 230,935,623 people shows a moderate positive correlation between the proportion of Apache and unemployment in the United States with a correlation coefficient (R) of 0.406 and weighted average of 7.4%. Similarly, the statistical analysis conducted on geographies consisting of 327,226,507 people shows a moderate positive correlation between the proportion of Hawaiians and unemployment in the United States with a correlation coefficient (R) of 0.415 and weighted average of 5.5%, a difference of 35.3%.
Unemployment Correlation Summary
| Measurement | Apache | Hawaiian |
| Minimum | 1.9% | 0.40% |
| Maximum | 34.3% | 20.0% |
| Range | 32.4% | 19.6% |
| Mean | 14.0% | 7.0% |
| Median | 10.8% | 5.6% |
| Interquartile 25% (IQ1) | 8.5% | 4.8% |
| Interquartile 75% (IQ3) | 16.0% | 8.4% |
| Interquartile Range (IQR) | 7.5% | 3.6% |
| Standard Deviation (Sample) | 8.8% | 3.8% |
| Standard Deviation (Population) | 8.7% | 3.8% |
Similar Demographics by Unemployment
Demographics Similar to Apache by Unemployment
In terms of unemployment, the demographic groups most similar to Apache are Immigrants from Dominican Republic (7.4%, a difference of 0.47%), Sioux (7.4%, a difference of 0.53%), Dominican (7.4%, a difference of 0.95%), Yakama (7.3%, a difference of 1.3%), and Alaska Native (7.2%, a difference of 2.6%).
| Demographics | Rating | Rank | Unemployment |
| Pueblo | 0.0 /100 | #327 | Tragic 7.2% |
| Tsimshian | 0.0 /100 | #328 | Tragic 7.2% |
| Alaska Natives | 0.0 /100 | #329 | Tragic 7.2% |
| Yakama | 0.0 /100 | #330 | Tragic 7.3% |
| Dominicans | 0.0 /100 | #331 | Tragic 7.4% |
| Sioux | 0.0 /100 | #332 | Tragic 7.4% |
| Immigrants | Dominican Republic | 0.0 /100 | #333 | Tragic 7.4% |
| Apache | 0.0 /100 | #334 | Tragic 7.4% |
| Alaskan Athabascans | 0.0 /100 | #335 | Tragic 7.7% |
| Immigrants | Yemen | 0.0 /100 | #336 | Tragic 7.7% |
| Cheyenne | 0.0 /100 | #337 | Tragic 8.0% |
| Pima | 0.0 /100 | #338 | Tragic 8.2% |
| Navajo | 0.0 /100 | #339 | Tragic 8.4% |
| Puerto Ricans | 0.0 /100 | #340 | Tragic 8.4% |
| Tohono O'odham | 0.0 /100 | #341 | Tragic 8.9% |
Demographics Similar to Hawaiians by Unemployment
In terms of unemployment, the demographic groups most similar to Hawaiians are Ottawa (5.5%, a difference of 0.0%), Immigrants from Africa (5.5%, a difference of 0.13%), Comanche (5.5%, a difference of 0.13%), Immigrants from Syria (5.5%, a difference of 0.18%), and Panamanian (5.5%, a difference of 0.21%).
| Demographics | Rating | Rank | Unemployment |
| Iroquois | 10.3 /100 | #222 | Poor 5.4% |
| Seminole | 9.2 /100 | #223 | Tragic 5.4% |
| Israelis | 8.8 /100 | #224 | Tragic 5.4% |
| South American Indians | 7.8 /100 | #225 | Tragic 5.5% |
| Samoans | 7.1 /100 | #226 | Tragic 5.5% |
| Immigrants | Lebanon | 7.0 /100 | #227 | Tragic 5.5% |
| Guamanians/Chamorros | 6.3 /100 | #228 | Tragic 5.5% |
| Hawaiians | 5.4 /100 | #229 | Tragic 5.5% |
| Ottawa | 5.4 /100 | #230 | Tragic 5.5% |
| Immigrants | Africa | 4.9 /100 | #231 | Tragic 5.5% |
| Comanche | 4.9 /100 | #232 | Tragic 5.5% |
| Immigrants | Syria | 4.8 /100 | #233 | Tragic 5.5% |
| Panamanians | 4.7 /100 | #234 | Tragic 5.5% |
| Immigrants | Panama | 3.4 /100 | #235 | Tragic 5.5% |
| Immigrants | Cambodia | 3.3 /100 | #236 | Tragic 5.5% |