Cajun vs Irish Unemployment Among Women with Children Under 6 years
COMPARE
Cajun
Irish
Unemployment Among Women with Children Under 6 years
Unemployment Among Women with Children Under 6 years Comparison
Cajuns
Irish
9.2%
UNEMPLOYMENT AMONG WOMEN WITH CHILDREN UNDER 6 YEARS
0.0/ 100
METRIC RATING
310th/ 347
METRIC RANK
8.1%
UNEMPLOYMENT AMONG WOMEN WITH CHILDREN UNDER 6 YEARS
2.7/ 100
METRIC RATING
239th/ 347
METRIC RANK
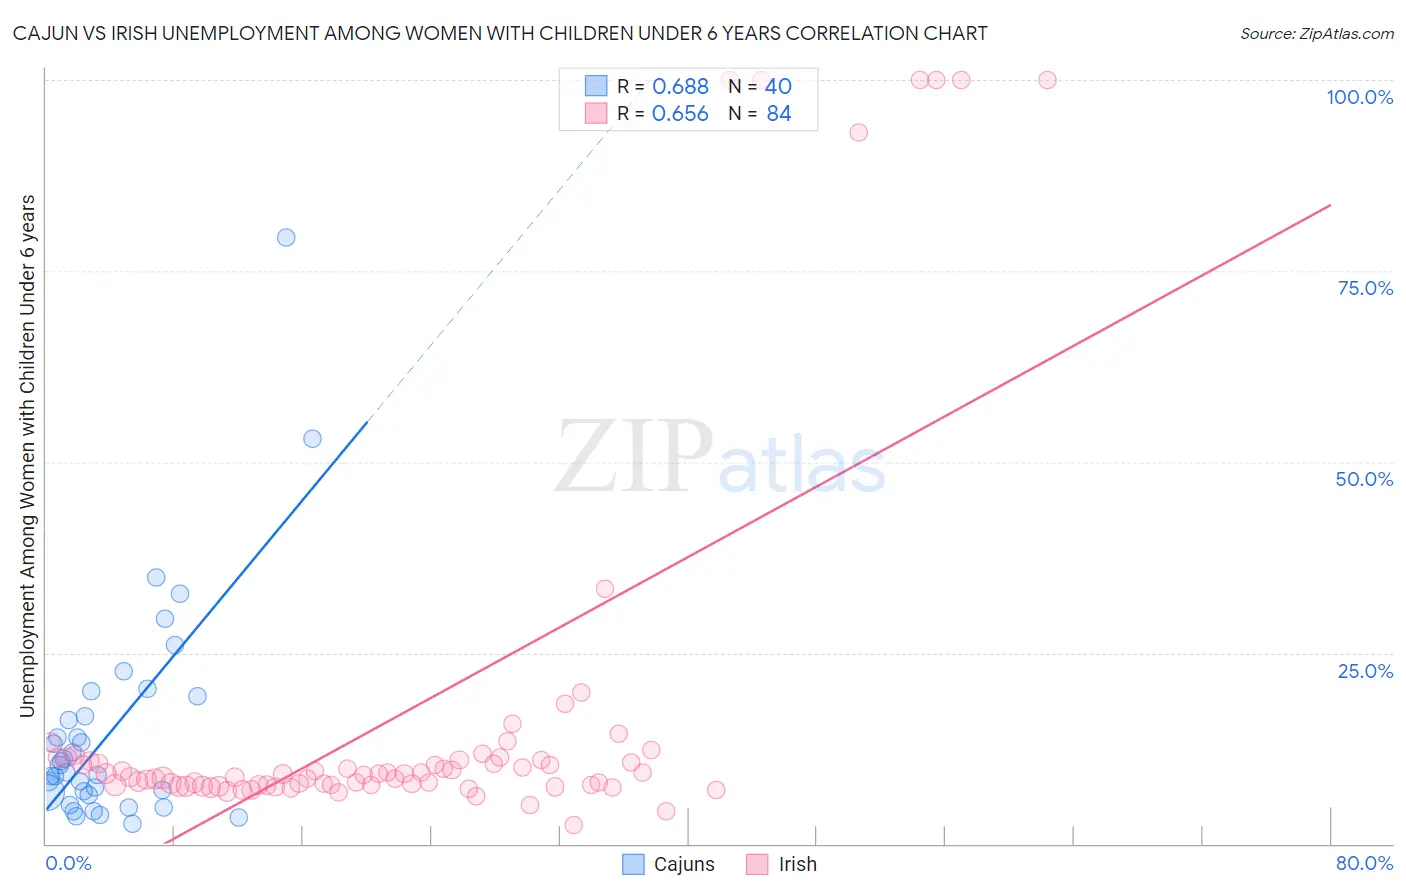
Cajun vs Irish Unemployment Among Women with Children Under 6 years Correlation Chart
The statistical analysis conducted on geographies consisting of 126,859,508 people shows a significant positive correlation between the proportion of Cajuns and unemployment rate among women with children under the age of 6 in the United States with a correlation coefficient (R) of 0.688 and weighted average of 9.2%. Similarly, the statistical analysis conducted on geographies consisting of 378,985,462 people shows a significant positive correlation between the proportion of Irish and unemployment rate among women with children under the age of 6 in the United States with a correlation coefficient (R) of 0.656 and weighted average of 8.1%, a difference of 13.3%.
Unemployment Among Women with Children Under 6 years Correlation Summary
| Measurement | Cajun | Irish |
| Minimum | 2.6% | 2.5% |
| Maximum | 79.4% | 100.0% |
| Range | 76.8% | 97.5% |
| Mean | 14.8% | 16.9% |
| Median | 9.8% | 9.1% |
| Interquartile 25% (IQ1) | 6.5% | 7.7% |
| Interquartile 75% (IQ3) | 18.1% | 11.0% |
| Interquartile Range (IQR) | 11.5% | 3.3% |
| Standard Deviation (Sample) | 14.7% | 25.2% |
| Standard Deviation (Population) | 14.6% | 25.0% |
Similar Demographics by Unemployment Among Women with Children Under 6 years
Demographics Similar to Cajuns by Unemployment Among Women with Children Under 6 years
In terms of unemployment among women with children under 6 years, the demographic groups most similar to Cajuns are African (9.2%, a difference of 0.13%), French American Indian (9.2%, a difference of 0.28%), Immigrants from the Azores (9.2%, a difference of 0.42%), Immigrants from Micronesia (9.1%, a difference of 0.53%), and Dominican (9.1%, a difference of 0.59%).
| Demographics | Rating | Rank | Unemployment Among Women with Children Under 6 years |
| Immigrants | West Indies | 0.0 /100 | #303 | Tragic 9.0% |
| Immigrants | Mexico | 0.0 /100 | #304 | Tragic 9.1% |
| Alaskan Athabascans | 0.0 /100 | #305 | Tragic 9.1% |
| Pueblo | 0.0 /100 | #306 | Tragic 9.1% |
| Dominicans | 0.0 /100 | #307 | Tragic 9.1% |
| Immigrants | Micronesia | 0.0 /100 | #308 | Tragic 9.1% |
| Africans | 0.0 /100 | #309 | Tragic 9.2% |
| Cajuns | 0.0 /100 | #310 | Tragic 9.2% |
| French American Indians | 0.0 /100 | #311 | Tragic 9.2% |
| Immigrants | Azores | 0.0 /100 | #312 | Tragic 9.2% |
| Americans | 0.0 /100 | #313 | Tragic 9.3% |
| Fijians | 0.0 /100 | #314 | Tragic 9.3% |
| Cherokee | 0.0 /100 | #315 | Tragic 9.3% |
| Houma | 0.0 /100 | #316 | Tragic 9.4% |
| Dutch West Indians | 0.0 /100 | #317 | Tragic 9.5% |
Demographics Similar to Irish by Unemployment Among Women with Children Under 6 years
In terms of unemployment among women with children under 6 years, the demographic groups most similar to Irish are Immigrants from El Salvador (8.1%, a difference of 0.070%), Liberian (8.1%, a difference of 0.10%), Dutch (8.1%, a difference of 0.16%), Immigrants from Middle Africa (8.1%, a difference of 0.26%), and Immigrants from Costa Rica (8.0%, a difference of 0.65%).
| Demographics | Rating | Rank | Unemployment Among Women with Children Under 6 years |
| Welsh | 5.0 /100 | #232 | Tragic 8.0% |
| Immigrants | Trinidad and Tobago | 4.8 /100 | #233 | Tragic 8.0% |
| Kiowa | 4.4 /100 | #234 | Tragic 8.0% |
| Comanche | 4.3 /100 | #235 | Tragic 8.0% |
| Immigrants | Barbados | 4.2 /100 | #236 | Tragic 8.0% |
| Immigrants | Costa Rica | 4.1 /100 | #237 | Tragic 8.0% |
| Immigrants | Middle Africa | 3.2 /100 | #238 | Tragic 8.1% |
| Irish | 2.7 /100 | #239 | Tragic 8.1% |
| Immigrants | El Salvador | 2.6 /100 | #240 | Tragic 8.1% |
| Liberians | 2.6 /100 | #241 | Tragic 8.1% |
| Dutch | 2.5 /100 | #242 | Tragic 8.1% |
| Hawaiians | 1.8 /100 | #243 | Tragic 8.2% |
| French | 1.7 /100 | #244 | Tragic 8.2% |
| Native Hawaiians | 1.7 /100 | #245 | Tragic 8.2% |
| Central Americans | 1.4 /100 | #246 | Tragic 8.2% |