Cajun vs Menominee Unemployment Among Women with Children Under 6 years
COMPARE
Cajun
Menominee
Unemployment Among Women with Children Under 6 years
Unemployment Among Women with Children Under 6 years Comparison
Cajuns
Menominee
9.2%
UNEMPLOYMENT AMONG WOMEN WITH CHILDREN UNDER 6 YEARS
0.0/ 100
METRIC RATING
310th/ 347
METRIC RANK
8.7%
UNEMPLOYMENT AMONG WOMEN WITH CHILDREN UNDER 6 YEARS
0.0/ 100
METRIC RATING
287th/ 347
METRIC RANK
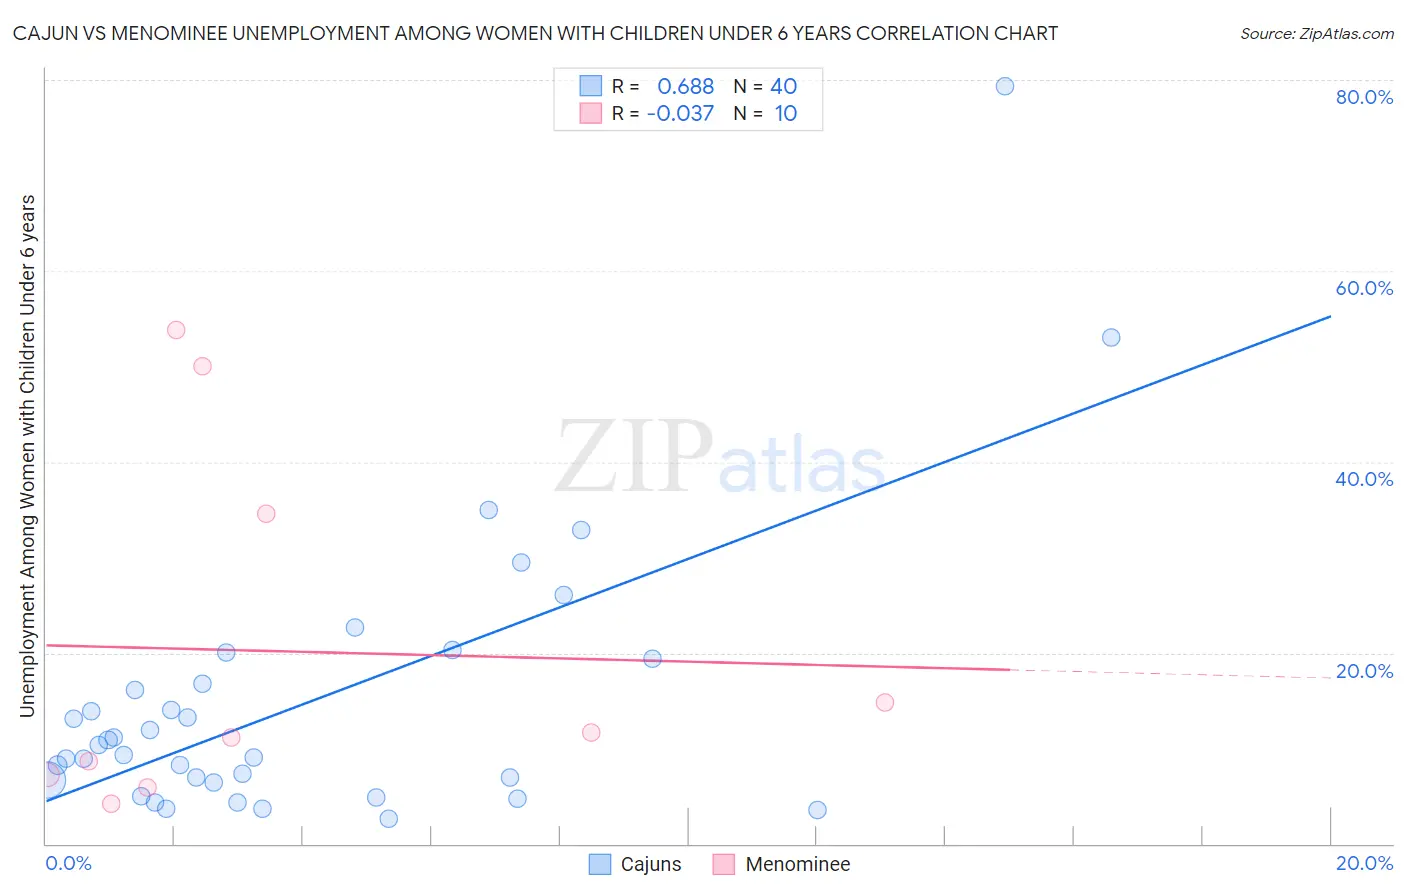
Cajun vs Menominee Unemployment Among Women with Children Under 6 years Correlation Chart
The statistical analysis conducted on geographies consisting of 126,859,508 people shows a significant positive correlation between the proportion of Cajuns and unemployment rate among women with children under the age of 6 in the United States with a correlation coefficient (R) of 0.688 and weighted average of 9.2%. Similarly, the statistical analysis conducted on geographies consisting of 41,178,371 people shows no correlation between the proportion of Menominee and unemployment rate among women with children under the age of 6 in the United States with a correlation coefficient (R) of -0.037 and weighted average of 8.7%, a difference of 5.3%.
Unemployment Among Women with Children Under 6 years Correlation Summary
| Measurement | Cajun | Menominee |
| Minimum | 2.6% | 4.2% |
| Maximum | 79.4% | 53.8% |
| Range | 76.8% | 49.6% |
| Mean | 14.8% | 20.2% |
| Median | 9.8% | 11.3% |
| Interquartile 25% (IQ1) | 6.5% | 7.2% |
| Interquartile 75% (IQ3) | 18.1% | 34.6% |
| Interquartile Range (IQR) | 11.5% | 27.4% |
| Standard Deviation (Sample) | 14.7% | 18.8% |
| Standard Deviation (Population) | 14.6% | 17.8% |
Similar Demographics by Unemployment Among Women with Children Under 6 years
Demographics Similar to Cajuns by Unemployment Among Women with Children Under 6 years
In terms of unemployment among women with children under 6 years, the demographic groups most similar to Cajuns are African (9.2%, a difference of 0.13%), French American Indian (9.2%, a difference of 0.28%), Immigrants from the Azores (9.2%, a difference of 0.42%), Immigrants from Micronesia (9.1%, a difference of 0.53%), and Dominican (9.1%, a difference of 0.59%).
| Demographics | Rating | Rank | Unemployment Among Women with Children Under 6 years |
| Immigrants | West Indies | 0.0 /100 | #303 | Tragic 9.0% |
| Immigrants | Mexico | 0.0 /100 | #304 | Tragic 9.1% |
| Alaskan Athabascans | 0.0 /100 | #305 | Tragic 9.1% |
| Pueblo | 0.0 /100 | #306 | Tragic 9.1% |
| Dominicans | 0.0 /100 | #307 | Tragic 9.1% |
| Immigrants | Micronesia | 0.0 /100 | #308 | Tragic 9.1% |
| Africans | 0.0 /100 | #309 | Tragic 9.2% |
| Cajuns | 0.0 /100 | #310 | Tragic 9.2% |
| French American Indians | 0.0 /100 | #311 | Tragic 9.2% |
| Immigrants | Azores | 0.0 /100 | #312 | Tragic 9.2% |
| Americans | 0.0 /100 | #313 | Tragic 9.3% |
| Fijians | 0.0 /100 | #314 | Tragic 9.3% |
| Cherokee | 0.0 /100 | #315 | Tragic 9.3% |
| Houma | 0.0 /100 | #316 | Tragic 9.4% |
| Dutch West Indians | 0.0 /100 | #317 | Tragic 9.5% |
Demographics Similar to Menominee by Unemployment Among Women with Children Under 6 years
In terms of unemployment among women with children under 6 years, the demographic groups most similar to Menominee are U.S. Virgin Islander (8.7%, a difference of 0.15%), Seminole (8.7%, a difference of 0.15%), Bahamian (8.7%, a difference of 0.20%), Iroquois (8.7%, a difference of 0.31%), and Blackfeet (8.7%, a difference of 0.35%).
| Demographics | Rating | Rank | Unemployment Among Women with Children Under 6 years |
| Immigrants | Belize | 0.0 /100 | #280 | Tragic 8.6% |
| Guatemalans | 0.0 /100 | #281 | Tragic 8.7% |
| Bermudans | 0.0 /100 | #282 | Tragic 8.7% |
| Spanish American Indians | 0.0 /100 | #283 | Tragic 8.7% |
| Blackfeet | 0.0 /100 | #284 | Tragic 8.7% |
| U.S. Virgin Islanders | 0.0 /100 | #285 | Tragic 8.7% |
| Seminole | 0.0 /100 | #286 | Tragic 8.7% |
| Menominee | 0.0 /100 | #287 | Tragic 8.7% |
| Bahamians | 0.0 /100 | #288 | Tragic 8.7% |
| Iroquois | 0.0 /100 | #289 | Tragic 8.7% |
| Vietnamese | 0.0 /100 | #290 | Tragic 8.8% |
| Jamaicans | 0.0 /100 | #291 | Tragic 8.8% |
| Cheyenne | 0.0 /100 | #292 | Tragic 8.8% |
| Immigrants | Bangladesh | 0.0 /100 | #293 | Tragic 8.8% |
| Immigrants | Nonimmigrants | 0.0 /100 | #294 | Tragic 8.8% |