French Canadian vs Czechoslovakian Male Unemployment
COMPARE
French Canadian
Czechoslovakian
Male Unemployment
Male Unemployment Comparison
French Canadians
Czechoslovakians
5.1%
MALE UNEMPLOYMENT
88.6/ 100
METRIC RATING
119th/ 347
METRIC RANK
5.0%
MALE UNEMPLOYMENT
98.7/ 100
METRIC RATING
55th/ 347
METRIC RANK
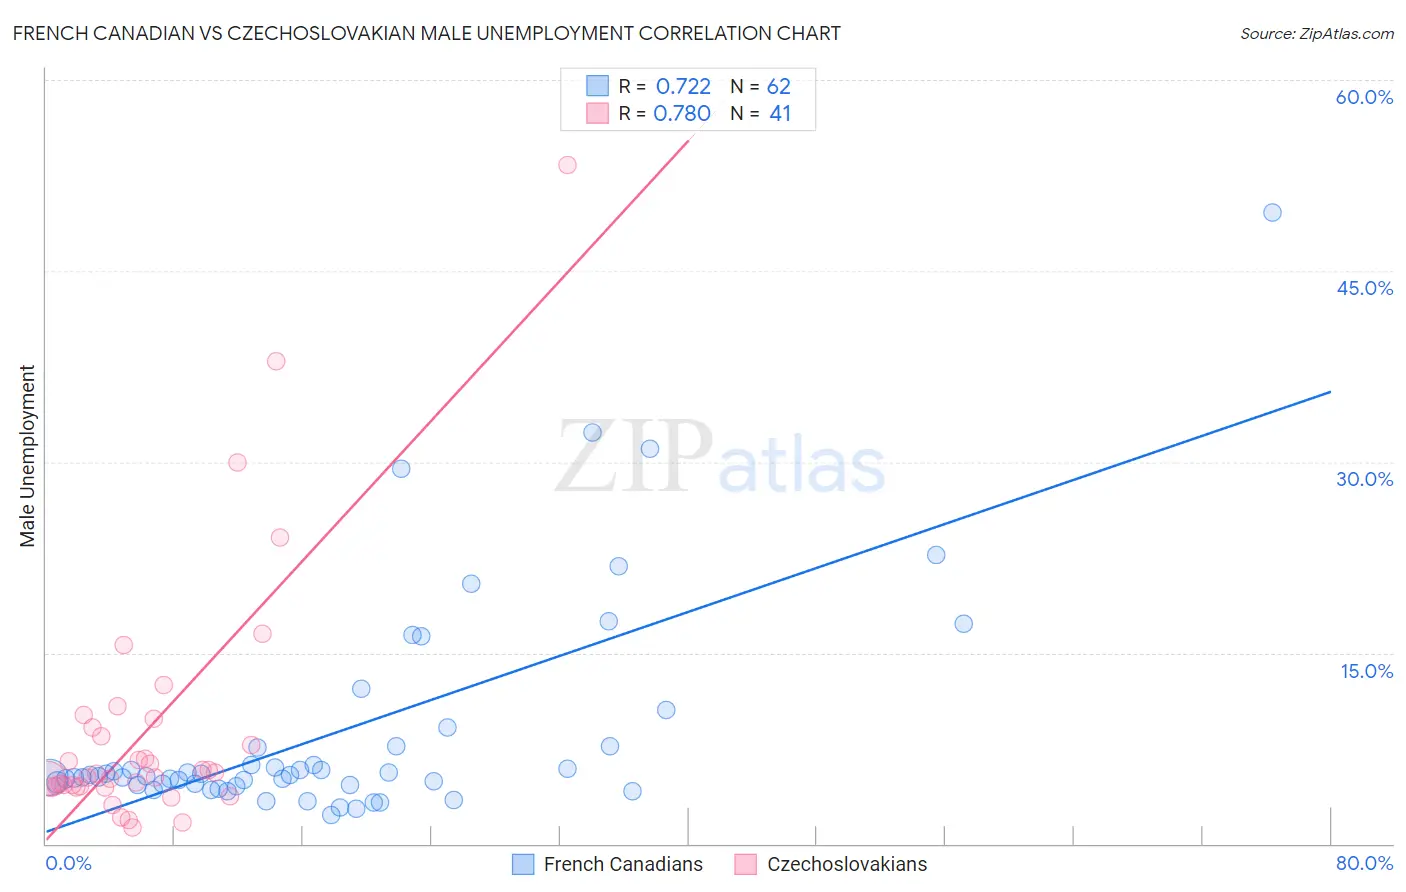
French Canadian vs Czechoslovakian Male Unemployment Correlation Chart
The statistical analysis conducted on geographies consisting of 497,036,739 people shows a strong positive correlation between the proportion of French Canadians and unemployment rate among males in the United States with a correlation coefficient (R) of 0.722 and weighted average of 5.1%. Similarly, the statistical analysis conducted on geographies consisting of 366,692,431 people shows a strong positive correlation between the proportion of Czechoslovakians and unemployment rate among males in the United States with a correlation coefficient (R) of 0.780 and weighted average of 5.0%, a difference of 3.5%.
Male Unemployment Correlation Summary
| Measurement | French Canadian | Czechoslovakian |
| Minimum | 2.3% | 1.3% |
| Maximum | 49.6% | 53.3% |
| Range | 47.3% | 52.0% |
| Mean | 8.8% | 9.1% |
| Median | 5.3% | 5.5% |
| Interquartile 25% (IQ1) | 4.7% | 4.5% |
| Interquartile 75% (IQ3) | 7.7% | 9.5% |
| Interquartile Range (IQR) | 3.0% | 5.1% |
| Standard Deviation (Sample) | 8.8% | 10.2% |
| Standard Deviation (Population) | 8.7% | 10.1% |
Similar Demographics by Male Unemployment
Demographics Similar to French Canadians by Male Unemployment
In terms of male unemployment, the demographic groups most similar to French Canadians are Ukrainian (5.1%, a difference of 0.020%), Mongolian (5.1%, a difference of 0.030%), Cypriot (5.1%, a difference of 0.040%), Nicaraguan (5.1%, a difference of 0.060%), and Estonian (5.1%, a difference of 0.070%).
| Demographics | Rating | Rank | Male Unemployment |
| Immigrants | Moldova | 90.3 /100 | #112 | Exceptional 5.1% |
| Immigrants | Austria | 90.3 /100 | #113 | Exceptional 5.1% |
| Romanians | 89.8 /100 | #114 | Excellent 5.1% |
| Immigrants | Asia | 89.6 /100 | #115 | Excellent 5.1% |
| Immigrants | Denmark | 89.4 /100 | #116 | Excellent 5.1% |
| Estonians | 89.0 /100 | #117 | Excellent 5.1% |
| Cypriots | 88.8 /100 | #118 | Excellent 5.1% |
| French Canadians | 88.6 /100 | #119 | Excellent 5.1% |
| Ukrainians | 88.4 /100 | #120 | Excellent 5.1% |
| Mongolians | 88.4 /100 | #121 | Excellent 5.1% |
| Nicaraguans | 88.2 /100 | #122 | Excellent 5.1% |
| Palestinians | 87.7 /100 | #123 | Excellent 5.1% |
| Immigrants | Latvia | 87.5 /100 | #124 | Excellent 5.1% |
| Immigrants | Lithuania | 87.2 /100 | #125 | Excellent 5.1% |
| Immigrants | Colombia | 86.8 /100 | #126 | Excellent 5.1% |
Demographics Similar to Czechoslovakians by Male Unemployment
In terms of male unemployment, the demographic groups most similar to Czechoslovakians are Yugoslavian (5.0%, a difference of 0.0%), Immigrants from Bulgaria (5.0%, a difference of 0.0%), Jordanian (5.0%, a difference of 0.11%), Irish (5.0%, a difference of 0.17%), and Slovene (5.0%, a difference of 0.19%).
| Demographics | Rating | Rank | Male Unemployment |
| Immigrants | Scotland | 98.9 /100 | #48 | Exceptional 4.9% |
| Poles | 98.9 /100 | #49 | Exceptional 4.9% |
| Croatians | 98.9 /100 | #50 | Exceptional 4.9% |
| Slovenes | 98.8 /100 | #51 | Exceptional 5.0% |
| Irish | 98.8 /100 | #52 | Exceptional 5.0% |
| Jordanians | 98.8 /100 | #53 | Exceptional 5.0% |
| Yugoslavians | 98.7 /100 | #54 | Exceptional 5.0% |
| Czechoslovakians | 98.7 /100 | #55 | Exceptional 5.0% |
| Immigrants | Bulgaria | 98.7 /100 | #56 | Exceptional 5.0% |
| Turks | 98.5 /100 | #57 | Exceptional 5.0% |
| Lithuanians | 98.5 /100 | #58 | Exceptional 5.0% |
| Immigrants | Netherlands | 98.3 /100 | #59 | Exceptional 5.0% |
| Immigrants | Argentina | 98.1 /100 | #60 | Exceptional 5.0% |
| Cambodians | 98.1 /100 | #61 | Exceptional 5.0% |
| Basques | 97.9 /100 | #62 | Exceptional 5.0% |