Burmese vs Yup'ik Male Unemployment
COMPARE
Burmese
Yup'ik
Male Unemployment
Male Unemployment Comparison
Burmese
Yup'ik
4.9%
MALE UNEMPLOYMENT
99.3/ 100
METRIC RATING
39th/ 347
METRIC RANK
16.4%
MALE UNEMPLOYMENT
0.0/ 100
METRIC RATING
347th/ 347
METRIC RANK
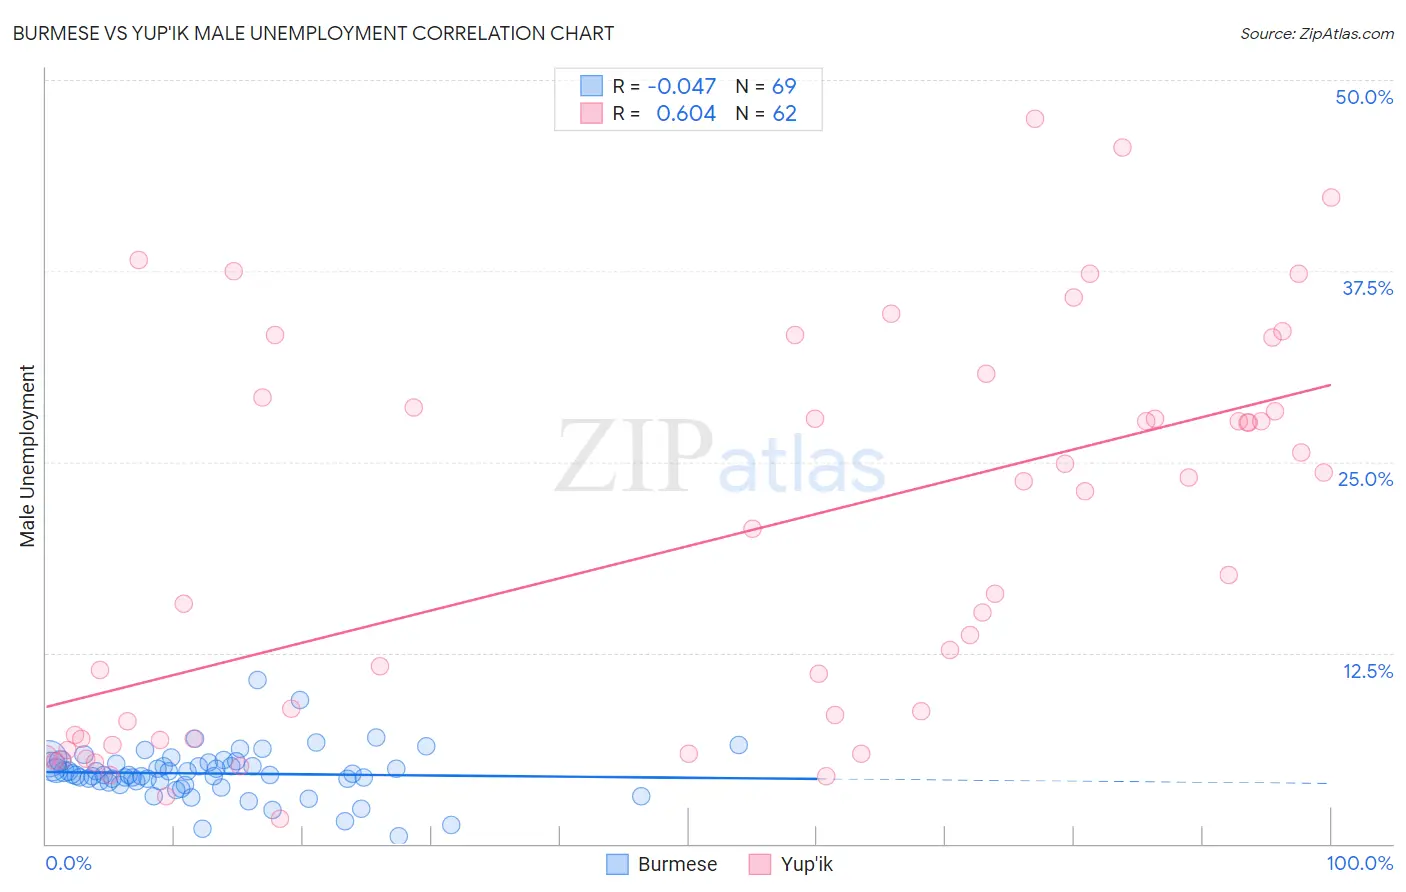
Burmese vs Yup'ik Male Unemployment Correlation Chart
The statistical analysis conducted on geographies consisting of 462,600,368 people shows no correlation between the proportion of Burmese and unemployment rate among males in the United States with a correlation coefficient (R) of -0.047 and weighted average of 4.9%. Similarly, the statistical analysis conducted on geographies consisting of 39,936,758 people shows a significant positive correlation between the proportion of Yup'ik and unemployment rate among males in the United States with a correlation coefficient (R) of 0.604 and weighted average of 16.4%, a difference of 234.8%.
Male Unemployment Correlation Summary
| Measurement | Burmese | Yup'ik |
| Minimum | 0.50% | 1.6% |
| Maximum | 10.7% | 47.5% |
| Range | 10.2% | 45.9% |
| Mean | 4.6% | 19.7% |
| Median | 4.5% | 19.1% |
| Interquartile 25% (IQ1) | 4.0% | 6.9% |
| Interquartile 75% (IQ3) | 5.3% | 28.6% |
| Interquartile Range (IQR) | 1.2% | 21.7% |
| Standard Deviation (Sample) | 1.6% | 12.8% |
| Standard Deviation (Population) | 1.6% | 12.7% |
Similar Demographics by Male Unemployment
Demographics Similar to Burmese by Male Unemployment
In terms of male unemployment, the demographic groups most similar to Burmese are Immigrants from Bosnia and Herzegovina (4.9%, a difference of 0.070%), Northern European (4.9%, a difference of 0.080%), Scotch-Irish (4.9%, a difference of 0.090%), Chinese (4.9%, a difference of 0.17%), and Immigrants from Belgium (4.9%, a difference of 0.19%).
| Demographics | Rating | Rank | Male Unemployment |
| Immigrants | Nepal | 99.8 /100 | #32 | Exceptional 4.8% |
| Latvians | 99.7 /100 | #33 | Exceptional 4.8% |
| Welsh | 99.7 /100 | #34 | Exceptional 4.8% |
| Paraguayans | 99.5 /100 | #35 | Exceptional 4.9% |
| Immigrants | Singapore | 99.4 /100 | #36 | Exceptional 4.9% |
| Scotch-Irish | 99.4 /100 | #37 | Exceptional 4.9% |
| Immigrants | Bosnia and Herzegovina | 99.4 /100 | #38 | Exceptional 4.9% |
| Burmese | 99.3 /100 | #39 | Exceptional 4.9% |
| Northern Europeans | 99.3 /100 | #40 | Exceptional 4.9% |
| Chinese | 99.3 /100 | #41 | Exceptional 4.9% |
| Immigrants | Belgium | 99.2 /100 | #42 | Exceptional 4.9% |
| Immigrants | Japan | 99.2 /100 | #43 | Exceptional 4.9% |
| Immigrants | Korea | 99.1 /100 | #44 | Exceptional 4.9% |
| Immigrants | Zimbabwe | 99.0 /100 | #45 | Exceptional 4.9% |
| Bhutanese | 98.9 /100 | #46 | Exceptional 4.9% |
Demographics Similar to Yup'ik by Male Unemployment
In terms of male unemployment, the demographic groups most similar to Yup'ik are Inupiat (12.1%, a difference of 36.1%), Arapaho (11.0%, a difference of 49.4%), Hopi (10.8%, a difference of 52.4%), Crow (10.6%, a difference of 54.9%), and Tohono O'odham (10.2%, a difference of 61.7%).
| Demographics | Rating | Rank | Male Unemployment |
| Sioux | 0.0 /100 | #333 | Tragic 8.4% |
| Tsimshian | 0.0 /100 | #334 | Tragic 8.5% |
| Pueblo | 0.0 /100 | #335 | Tragic 8.5% |
| Yuman | 0.0 /100 | #336 | Tragic 8.6% |
| Puerto Ricans | 0.0 /100 | #337 | Tragic 8.6% |
| Apache | 0.0 /100 | #338 | Tragic 8.6% |
| Cheyenne | 0.0 /100 | #339 | Tragic 9.8% |
| Alaskan Athabascans | 0.0 /100 | #340 | Tragic 9.8% |
| Navajo | 0.0 /100 | #341 | Tragic 9.8% |
| Tohono O'odham | 0.0 /100 | #342 | Tragic 10.2% |
| Crow | 0.0 /100 | #343 | Tragic 10.6% |
| Hopi | 0.0 /100 | #344 | Tragic 10.8% |
| Arapaho | 0.0 /100 | #345 | Tragic 11.0% |
| Inupiat | 0.0 /100 | #346 | Tragic 12.1% |
| Yup'ik | 0.0 /100 | #347 | Tragic 16.4% |