Burmese vs Nepalese Male Unemployment
COMPARE
Burmese
Nepalese
Male Unemployment
Male Unemployment Comparison
Burmese
Nepalese
4.9%
MALE UNEMPLOYMENT
99.3/ 100
METRIC RATING
39th/ 347
METRIC RANK
6.4%
MALE UNEMPLOYMENT
0.0/ 100
METRIC RATING
292nd/ 347
METRIC RANK
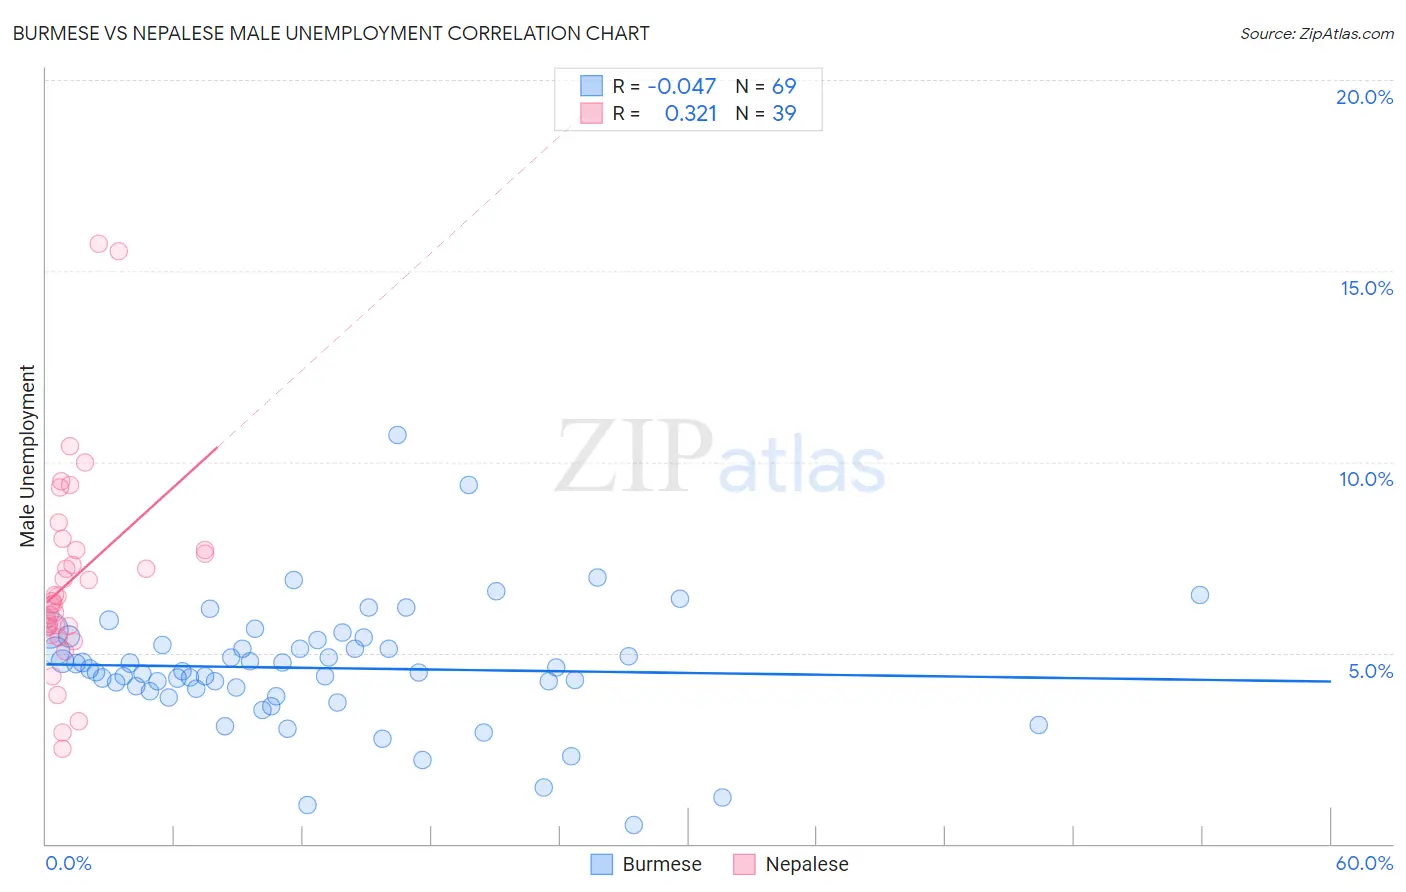
Burmese vs Nepalese Male Unemployment Correlation Chart
The statistical analysis conducted on geographies consisting of 462,600,368 people shows no correlation between the proportion of Burmese and unemployment rate among males in the United States with a correlation coefficient (R) of -0.047 and weighted average of 4.9%. Similarly, the statistical analysis conducted on geographies consisting of 24,511,248 people shows a mild positive correlation between the proportion of Nepalese and unemployment rate among males in the United States with a correlation coefficient (R) of 0.321 and weighted average of 6.4%, a difference of 31.1%.
Male Unemployment Correlation Summary
| Measurement | Burmese | Nepalese |
| Minimum | 0.50% | 2.5% |
| Maximum | 10.7% | 15.7% |
| Range | 10.2% | 13.2% |
| Mean | 4.6% | 7.0% |
| Median | 4.5% | 6.3% |
| Interquartile 25% (IQ1) | 4.0% | 5.7% |
| Interquartile 75% (IQ3) | 5.3% | 7.7% |
| Interquartile Range (IQR) | 1.2% | 2.0% |
| Standard Deviation (Sample) | 1.6% | 2.7% |
| Standard Deviation (Population) | 1.6% | 2.7% |
Similar Demographics by Male Unemployment
Demographics Similar to Burmese by Male Unemployment
In terms of male unemployment, the demographic groups most similar to Burmese are Immigrants from Bosnia and Herzegovina (4.9%, a difference of 0.070%), Northern European (4.9%, a difference of 0.080%), Scotch-Irish (4.9%, a difference of 0.090%), Chinese (4.9%, a difference of 0.17%), and Immigrants from Belgium (4.9%, a difference of 0.19%).
| Demographics | Rating | Rank | Male Unemployment |
| Immigrants | Nepal | 99.8 /100 | #32 | Exceptional 4.8% |
| Latvians | 99.7 /100 | #33 | Exceptional 4.8% |
| Welsh | 99.7 /100 | #34 | Exceptional 4.8% |
| Paraguayans | 99.5 /100 | #35 | Exceptional 4.9% |
| Immigrants | Singapore | 99.4 /100 | #36 | Exceptional 4.9% |
| Scotch-Irish | 99.4 /100 | #37 | Exceptional 4.9% |
| Immigrants | Bosnia and Herzegovina | 99.4 /100 | #38 | Exceptional 4.9% |
| Burmese | 99.3 /100 | #39 | Exceptional 4.9% |
| Northern Europeans | 99.3 /100 | #40 | Exceptional 4.9% |
| Chinese | 99.3 /100 | #41 | Exceptional 4.9% |
| Immigrants | Belgium | 99.2 /100 | #42 | Exceptional 4.9% |
| Immigrants | Japan | 99.2 /100 | #43 | Exceptional 4.9% |
| Immigrants | Korea | 99.1 /100 | #44 | Exceptional 4.9% |
| Immigrants | Zimbabwe | 99.0 /100 | #45 | Exceptional 4.9% |
| Bhutanese | 98.9 /100 | #46 | Exceptional 4.9% |
Demographics Similar to Nepalese by Male Unemployment
In terms of male unemployment, the demographic groups most similar to Nepalese are Haitian (6.4%, a difference of 0.030%), Senegalese (6.4%, a difference of 0.14%), Immigrants from the Azores (6.4%, a difference of 0.34%), U.S. Virgin Islander (6.4%, a difference of 0.87%), and Belizean (6.5%, a difference of 0.99%).
| Demographics | Rating | Rank | Male Unemployment |
| Immigrants | Ecuador | 0.0 /100 | #285 | Tragic 6.2% |
| Africans | 0.0 /100 | #286 | Tragic 6.3% |
| Central American Indians | 0.0 /100 | #287 | Tragic 6.3% |
| Immigrants | Senegal | 0.0 /100 | #288 | Tragic 6.3% |
| Immigrants | Caribbean | 0.0 /100 | #289 | Tragic 6.3% |
| U.S. Virgin Islanders | 0.0 /100 | #290 | Tragic 6.4% |
| Immigrants | Azores | 0.0 /100 | #291 | Tragic 6.4% |
| Nepalese | 0.0 /100 | #292 | Tragic 6.4% |
| Haitians | 0.0 /100 | #293 | Tragic 6.4% |
| Senegalese | 0.0 /100 | #294 | Tragic 6.4% |
| Belizeans | 0.0 /100 | #295 | Tragic 6.5% |
| Immigrants | Haiti | 0.0 /100 | #296 | Tragic 6.5% |
| Chippewa | 0.0 /100 | #297 | Tragic 6.6% |
| Jamaicans | 0.0 /100 | #298 | Tragic 6.6% |
| Immigrants | Bangladesh | 0.0 /100 | #299 | Tragic 6.6% |