Immigrants from Japan vs Cherokee Unemployment
COMPARE
Immigrants from Japan
Cherokee
Unemployment
Unemployment Comparison
Immigrants from Japan
Cherokee
4.9%
UNEMPLOYMENT
98.3/ 100
METRIC RATING
71st/ 347
METRIC RANK
5.3%
UNEMPLOYMENT
25.5/ 100
METRIC RATING
202nd/ 347
METRIC RANK
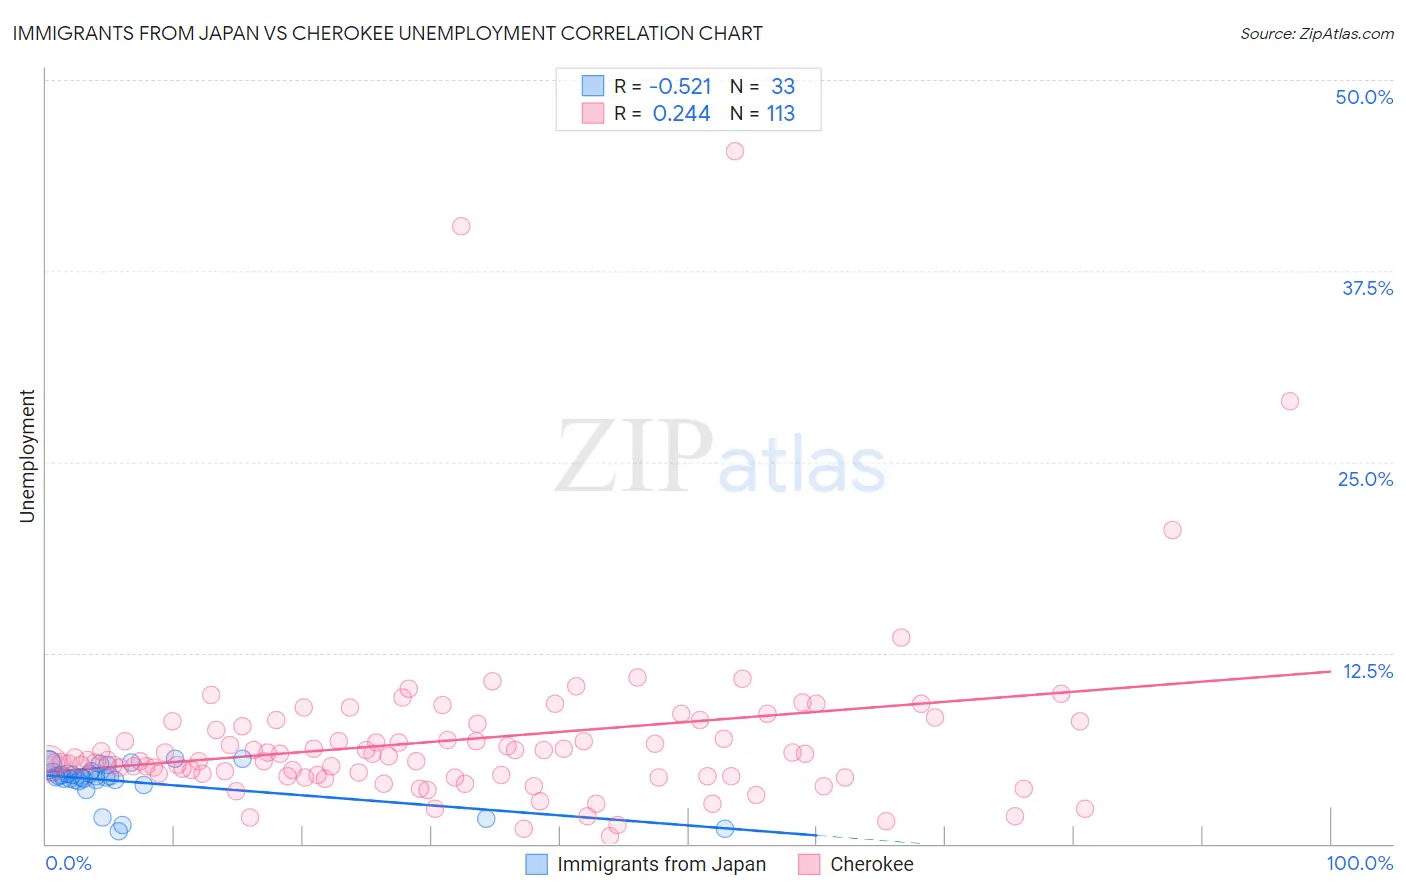
Immigrants from Japan vs Cherokee Unemployment Correlation Chart
The statistical analysis conducted on geographies consisting of 339,966,426 people shows a substantial negative correlation between the proportion of Immigrants from Japan and unemployment in the United States with a correlation coefficient (R) of -0.521 and weighted average of 4.9%. Similarly, the statistical analysis conducted on geographies consisting of 492,075,585 people shows a weak positive correlation between the proportion of Cherokee and unemployment in the United States with a correlation coefficient (R) of 0.244 and weighted average of 5.3%, a difference of 8.5%.
Unemployment Correlation Summary
| Measurement | Immigrants from Japan | Cherokee |
| Minimum | 0.80% | 0.50% |
| Maximum | 5.6% | 45.3% |
| Range | 4.8% | 44.8% |
| Mean | 4.1% | 6.8% |
| Median | 4.4% | 5.5% |
| Interquartile 25% (IQ1) | 4.1% | 4.4% |
| Interquartile 75% (IQ3) | 4.7% | 7.8% |
| Interquartile Range (IQR) | 0.58% | 3.3% |
| Standard Deviation (Sample) | 1.3% | 6.0% |
| Standard Deviation (Population) | 1.3% | 6.0% |
Similar Demographics by Unemployment
Demographics Similar to Immigrants from Japan by Unemployment
In terms of unemployment, the demographic groups most similar to Immigrants from Japan are Burmese (4.9%, a difference of 0.020%), Serbian (4.9%, a difference of 0.050%), Paraguayan (4.9%, a difference of 0.070%), Immigrants from Northern Europe (4.9%, a difference of 0.16%), and Immigrants from North America (4.9%, a difference of 0.21%).
| Demographics | Rating | Rank | Unemployment |
| Italians | 98.9 /100 | #64 | Exceptional 4.9% |
| Immigrants | Canada | 98.8 /100 | #65 | Exceptional 4.9% |
| Slovaks | 98.7 /100 | #66 | Exceptional 4.9% |
| New Zealanders | 98.6 /100 | #67 | Exceptional 4.9% |
| Slavs | 98.6 /100 | #68 | Exceptional 4.9% |
| Immigrants | North America | 98.5 /100 | #69 | Exceptional 4.9% |
| Serbians | 98.4 /100 | #70 | Exceptional 4.9% |
| Immigrants | Japan | 98.3 /100 | #71 | Exceptional 4.9% |
| Burmese | 98.3 /100 | #72 | Exceptional 4.9% |
| Paraguayans | 98.3 /100 | #73 | Exceptional 4.9% |
| Immigrants | Northern Europe | 98.2 /100 | #74 | Exceptional 4.9% |
| Turks | 98.0 /100 | #75 | Exceptional 4.9% |
| German Russians | 98.0 /100 | #76 | Exceptional 4.9% |
| Cypriots | 97.9 /100 | #77 | Exceptional 4.9% |
| Okinawans | 97.9 /100 | #78 | Exceptional 4.9% |
Demographics Similar to Cherokee by Unemployment
In terms of unemployment, the demographic groups most similar to Cherokee are Immigrants from Micronesia (5.3%, a difference of 0.030%), Immigrants from Ukraine (5.3%, a difference of 0.050%), Native Hawaiian (5.3%, a difference of 0.11%), Immigrants from South Eastern Asia (5.3%, a difference of 0.12%), and Korean (5.3%, a difference of 0.14%).
| Demographics | Rating | Rank | Unemployment |
| Immigrants | Southern Europe | 30.9 /100 | #195 | Fair 5.3% |
| Peruvians | 29.9 /100 | #196 | Fair 5.3% |
| Immigrants | Uruguay | 29.8 /100 | #197 | Fair 5.3% |
| Immigrants | Israel | 28.6 /100 | #198 | Fair 5.3% |
| Immigrants | Afghanistan | 28.6 /100 | #199 | Fair 5.3% |
| Koreans | 27.4 /100 | #200 | Fair 5.3% |
| Immigrants | South Eastern Asia | 27.0 /100 | #201 | Fair 5.3% |
| Cherokee | 25.5 /100 | #202 | Fair 5.3% |
| Immigrants | Micronesia | 25.2 /100 | #203 | Fair 5.3% |
| Immigrants | Ukraine | 24.9 /100 | #204 | Fair 5.3% |
| Native Hawaiians | 24.1 /100 | #205 | Fair 5.3% |
| Immigrants | Peru | 22.7 /100 | #206 | Fair 5.4% |
| Creek | 19.4 /100 | #207 | Poor 5.4% |
| Portuguese | 19.0 /100 | #208 | Poor 5.4% |
| Immigrants | Iran | 18.8 /100 | #209 | Poor 5.4% |