Central American Indian vs Afghan Unemployment
COMPARE
Central American Indian
Afghan
Unemployment
Unemployment Comparison
Central American Indians
Afghans
6.2%
UNEMPLOYMENT
0.0/ 100
METRIC RATING
292nd/ 347
METRIC RANK
5.3%
UNEMPLOYMENT
47.4/ 100
METRIC RATING
178th/ 347
METRIC RANK
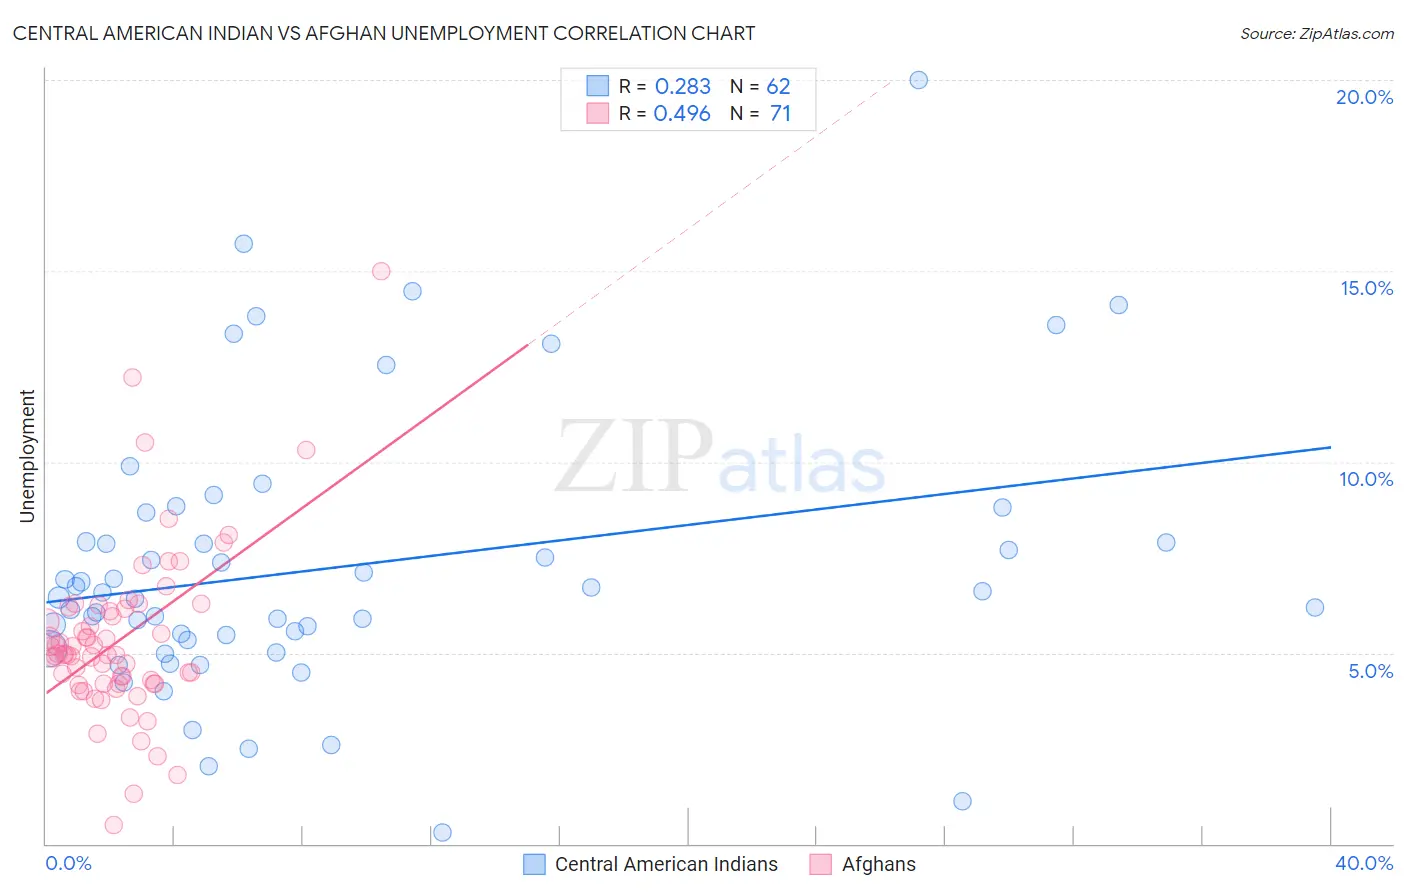
Central American Indian vs Afghan Unemployment Correlation Chart
The statistical analysis conducted on geographies consisting of 325,961,025 people shows a weak positive correlation between the proportion of Central American Indians and unemployment in the United States with a correlation coefficient (R) of 0.283 and weighted average of 6.2%. Similarly, the statistical analysis conducted on geographies consisting of 148,850,223 people shows a moderate positive correlation between the proportion of Afghans and unemployment in the United States with a correlation coefficient (R) of 0.496 and weighted average of 5.3%, a difference of 18.4%.
Unemployment Correlation Summary
| Measurement | Central American Indian | Afghan |
| Minimum | 0.30% | 0.50% |
| Maximum | 20.0% | 15.0% |
| Range | 19.7% | 14.5% |
| Mean | 7.2% | 5.3% |
| Median | 6.5% | 5.0% |
| Interquartile 25% (IQ1) | 5.3% | 4.2% |
| Interquartile 75% (IQ3) | 7.9% | 6.2% |
| Interquartile Range (IQR) | 2.6% | 2.0% |
| Standard Deviation (Sample) | 3.6% | 2.2% |
| Standard Deviation (Population) | 3.6% | 2.2% |
Similar Demographics by Unemployment
Demographics Similar to Central American Indians by Unemployment
In terms of unemployment, the demographic groups most similar to Central American Indians are Haitian (6.2%, a difference of 0.020%), Immigrants from Ecuador (6.2%, a difference of 0.090%), Spanish American Indian (6.2%, a difference of 0.090%), U.S. Virgin Islander (6.3%, a difference of 0.22%), and Senegalese (6.2%, a difference of 0.54%).
| Demographics | Rating | Rank | Unemployment |
| Immigrants | Senegal | 0.0 /100 | #285 | Tragic 6.1% |
| Immigrants | Caribbean | 0.0 /100 | #286 | Tragic 6.2% |
| Nepalese | 0.0 /100 | #287 | Tragic 6.2% |
| Ecuadorians | 0.0 /100 | #288 | Tragic 6.2% |
| Chippewa | 0.0 /100 | #289 | Tragic 6.2% |
| Senegalese | 0.0 /100 | #290 | Tragic 6.2% |
| Haitians | 0.0 /100 | #291 | Tragic 6.2% |
| Central American Indians | 0.0 /100 | #292 | Tragic 6.2% |
| Immigrants | Ecuador | 0.0 /100 | #293 | Tragic 6.2% |
| Spanish American Indians | 0.0 /100 | #294 | Tragic 6.2% |
| U.S. Virgin Islanders | 0.0 /100 | #295 | Tragic 6.3% |
| Ute | 0.0 /100 | #296 | Tragic 6.3% |
| Jamaicans | 0.0 /100 | #297 | Tragic 6.3% |
| Immigrants | Haiti | 0.0 /100 | #298 | Tragic 6.3% |
| Immigrants | West Indies | 0.0 /100 | #299 | Tragic 6.3% |
Demographics Similar to Afghans by Unemployment
In terms of unemployment, the demographic groups most similar to Afghans are Nonimmigrants (5.3%, a difference of 0.030%), Malaysian (5.3%, a difference of 0.030%), Nicaraguan (5.3%, a difference of 0.080%), Taiwanese (5.3%, a difference of 0.14%), and Immigrants from Greece (5.3%, a difference of 0.15%).
| Demographics | Rating | Rank | Unemployment |
| Puget Sound Salish | 56.6 /100 | #171 | Average 5.2% |
| Immigrants | Vietnam | 52.5 /100 | #172 | Average 5.2% |
| Immigrants | Poland | 51.8 /100 | #173 | Average 5.3% |
| Immigrants | Congo | 50.0 /100 | #174 | Average 5.3% |
| Taiwanese | 49.6 /100 | #175 | Average 5.3% |
| Nicaraguans | 48.7 /100 | #176 | Average 5.3% |
| Immigrants | Nonimmigrants | 47.9 /100 | #177 | Average 5.3% |
| Afghans | 47.4 /100 | #178 | Average 5.3% |
| Malaysians | 46.8 /100 | #179 | Average 5.3% |
| Immigrants | Greece | 45.0 /100 | #180 | Average 5.3% |
| Albanians | 43.5 /100 | #181 | Average 5.3% |
| Spaniards | 42.2 /100 | #182 | Average 5.3% |
| Brazilians | 40.2 /100 | #183 | Average 5.3% |
| Assyrians/Chaldeans/Syriacs | 39.2 /100 | #184 | Fair 5.3% |
| Immigrants | Thailand | 38.9 /100 | #185 | Fair 5.3% |