British West Indian vs Taiwanese Unemployment Among Youth under 25 years
COMPARE
British West Indian
Taiwanese
Unemployment Among Youth under 25 years
Unemployment Among Youth under 25 years Comparison
British West Indians
Taiwanese
15.5%
UNEMPLOYMENT AMONG YOUTH UNDER 25 YEARS
0.0/ 100
METRIC RATING
327th/ 347
METRIC RANK
10.8%
UNEMPLOYMENT AMONG YOUTH UNDER 25 YEARS
99.9/ 100
METRIC RATING
32nd/ 347
METRIC RANK
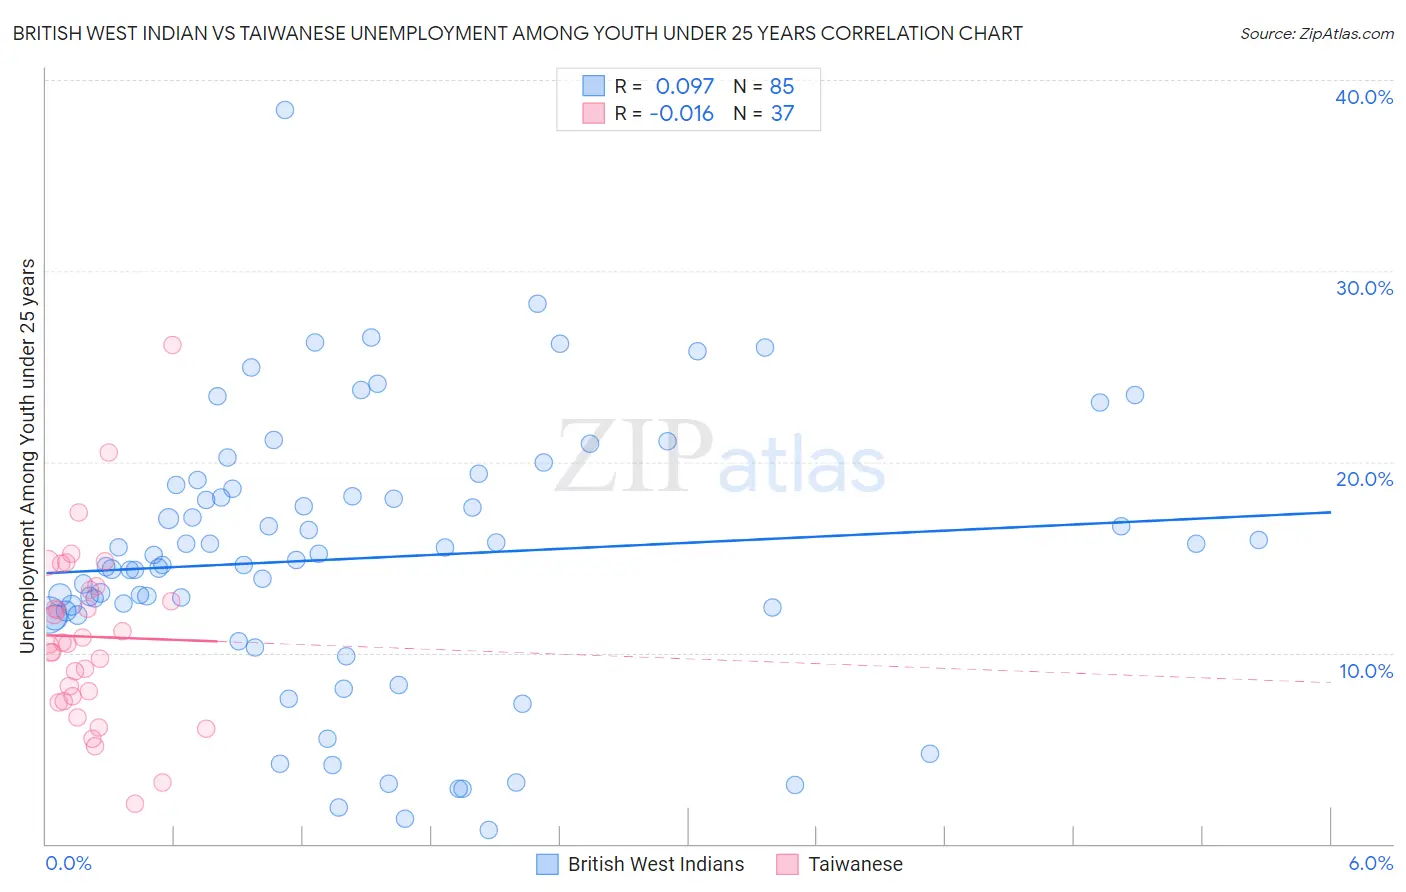
British West Indian vs Taiwanese Unemployment Among Youth under 25 years Correlation Chart
The statistical analysis conducted on geographies consisting of 152,199,351 people shows a slight positive correlation between the proportion of British West Indians and unemployment rate among youth under the age of 25 in the United States with a correlation coefficient (R) of 0.097 and weighted average of 15.5%. Similarly, the statistical analysis conducted on geographies consisting of 31,706,406 people shows no correlation between the proportion of Taiwanese and unemployment rate among youth under the age of 25 in the United States with a correlation coefficient (R) of -0.016 and weighted average of 10.8%, a difference of 44.5%.
Unemployment Among Youth under 25 years Correlation Summary
| Measurement | British West Indian | Taiwanese |
| Minimum | 0.70% | 2.1% |
| Maximum | 38.4% | 26.1% |
| Range | 37.7% | 24.0% |
| Mean | 14.9% | 10.8% |
| Median | 14.9% | 10.5% |
| Interquartile 25% (IQ1) | 12.0% | 7.6% |
| Interquartile 75% (IQ3) | 18.7% | 13.4% |
| Interquartile Range (IQR) | 6.7% | 5.8% |
| Standard Deviation (Sample) | 7.1% | 4.7% |
| Standard Deviation (Population) | 7.0% | 4.6% |
Similar Demographics by Unemployment Among Youth under 25 years
Demographics Similar to British West Indians by Unemployment Among Youth under 25 years
In terms of unemployment among youth under 25 years, the demographic groups most similar to British West Indians are Immigrants from Dominican Republic (15.6%, a difference of 0.11%), Immigrants from Yemen (15.6%, a difference of 0.24%), Yakama (15.6%, a difference of 0.28%), Dominican (15.7%, a difference of 1.1%), and Immigrants from Grenada (15.8%, a difference of 1.8%).
| Demographics | Rating | Rank | Unemployment Among Youth under 25 years |
| Barbadians | 0.0 /100 | #320 | Tragic 14.6% |
| Cheyenne | 0.0 /100 | #321 | Tragic 14.6% |
| Trinidadians and Tobagonians | 0.0 /100 | #322 | Tragic 14.6% |
| Immigrants | Trinidad and Tobago | 0.0 /100 | #323 | Tragic 14.6% |
| Immigrants | Jamaica | 0.0 /100 | #324 | Tragic 14.8% |
| Alaska Natives | 0.0 /100 | #325 | Tragic 14.9% |
| Immigrants | Barbados | 0.0 /100 | #326 | Tragic 15.2% |
| British West Indians | 0.0 /100 | #327 | Tragic 15.5% |
| Immigrants | Dominican Republic | 0.0 /100 | #328 | Tragic 15.6% |
| Immigrants | Yemen | 0.0 /100 | #329 | Tragic 15.6% |
| Yakama | 0.0 /100 | #330 | Tragic 15.6% |
| Dominicans | 0.0 /100 | #331 | Tragic 15.7% |
| Immigrants | Grenada | 0.0 /100 | #332 | Tragic 15.8% |
| Guyanese | 0.0 /100 | #333 | Tragic 15.9% |
| Immigrants | Guyana | 0.0 /100 | #334 | Tragic 15.9% |
Demographics Similar to Taiwanese by Unemployment Among Youth under 25 years
In terms of unemployment among youth under 25 years, the demographic groups most similar to Taiwanese are European (10.8%, a difference of 0.22%), Slovene (10.7%, a difference of 0.26%), Osage (10.7%, a difference of 0.37%), Chinese (10.7%, a difference of 0.44%), and English (10.8%, a difference of 0.50%).
| Demographics | Rating | Rank | Unemployment Among Youth under 25 years |
| Immigrants | North Macedonia | 100.0 /100 | #25 | Exceptional 10.7% |
| Immigrants | India | 100.0 /100 | #26 | Exceptional 10.7% |
| Yugoslavians | 100.0 /100 | #27 | Exceptional 10.7% |
| Somalis | 100.0 /100 | #28 | Exceptional 10.7% |
| Chinese | 99.9 /100 | #29 | Exceptional 10.7% |
| Osage | 99.9 /100 | #30 | Exceptional 10.7% |
| Slovenes | 99.9 /100 | #31 | Exceptional 10.7% |
| Taiwanese | 99.9 /100 | #32 | Exceptional 10.8% |
| Europeans | 99.9 /100 | #33 | Exceptional 10.8% |
| English | 99.9 /100 | #34 | Exceptional 10.8% |
| Immigrants | Nepal | 99.9 /100 | #35 | Exceptional 10.8% |
| Hmong | 99.8 /100 | #36 | Exceptional 10.8% |
| Immigrants | Zimbabwe | 99.8 /100 | #37 | Exceptional 10.8% |
| Immigrants | Congo | 99.8 /100 | #38 | Exceptional 10.9% |
| Immigrants | Zaire | 99.8 /100 | #39 | Exceptional 10.9% |