Immigrants from North America vs Taiwanese Unemployment Among Youth under 25 years
COMPARE
Immigrants from North America
Taiwanese
Unemployment Among Youth under 25 years
Unemployment Among Youth under 25 years Comparison
Immigrants from North America
Taiwanese
11.2%
UNEMPLOYMENT AMONG YOUTH UNDER 25 YEARS
95.1/ 100
METRIC RATING
93rd/ 347
METRIC RANK
10.8%
UNEMPLOYMENT AMONG YOUTH UNDER 25 YEARS
99.9/ 100
METRIC RATING
32nd/ 347
METRIC RANK
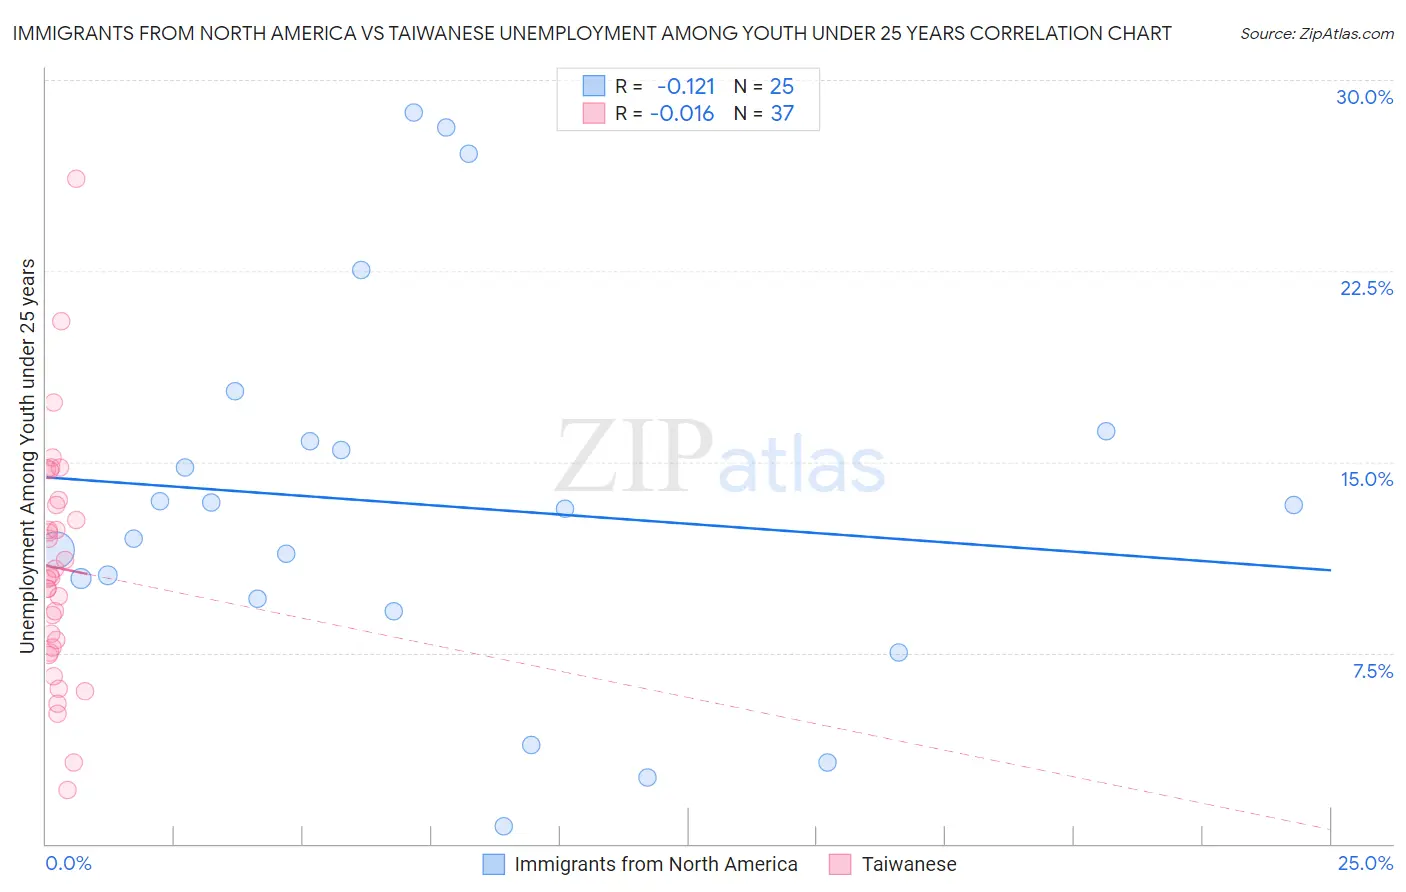
Immigrants from North America vs Taiwanese Unemployment Among Youth under 25 years Correlation Chart
The statistical analysis conducted on geographies consisting of 452,972,421 people shows a poor negative correlation between the proportion of Immigrants from North America and unemployment rate among youth under the age of 25 in the United States with a correlation coefficient (R) of -0.121 and weighted average of 11.2%. Similarly, the statistical analysis conducted on geographies consisting of 31,706,406 people shows no correlation between the proportion of Taiwanese and unemployment rate among youth under the age of 25 in the United States with a correlation coefficient (R) of -0.016 and weighted average of 10.8%, a difference of 4.6%.
Unemployment Among Youth under 25 years Correlation Summary
| Measurement | Immigrants from North America | Taiwanese |
| Minimum | 0.70% | 2.1% |
| Maximum | 28.7% | 26.1% |
| Range | 28.0% | 24.0% |
| Mean | 13.3% | 10.8% |
| Median | 13.1% | 10.5% |
| Interquartile 25% (IQ1) | 9.4% | 7.6% |
| Interquartile 75% (IQ3) | 16.0% | 13.4% |
| Interquartile Range (IQR) | 6.6% | 5.8% |
| Standard Deviation (Sample) | 7.4% | 4.7% |
| Standard Deviation (Population) | 7.3% | 4.6% |
Similar Demographics by Unemployment Among Youth under 25 years
Demographics Similar to Immigrants from North America by Unemployment Among Youth under 25 years
In terms of unemployment among youth under 25 years, the demographic groups most similar to Immigrants from North America are Immigrants from Taiwan (11.2%, a difference of 0.0%), Immigrants from Latvia (11.2%, a difference of 0.0%), Lithuanian (11.3%, a difference of 0.070%), Immigrants from Bolivia (11.2%, a difference of 0.080%), and Immigrants from Japan (11.2%, a difference of 0.090%).
| Demographics | Rating | Rank | Unemployment Among Youth under 25 years |
| Immigrants | South Africa | 95.8 /100 | #86 | Exceptional 11.2% |
| Kenyans | 95.7 /100 | #87 | Exceptional 11.2% |
| Austrians | 95.5 /100 | #88 | Exceptional 11.2% |
| Immigrants | Japan | 95.5 /100 | #89 | Exceptional 11.2% |
| Immigrants | Bolivia | 95.5 /100 | #90 | Exceptional 11.2% |
| Immigrants | Taiwan | 95.1 /100 | #91 | Exceptional 11.2% |
| Immigrants | Latvia | 95.1 /100 | #92 | Exceptional 11.2% |
| Immigrants | North America | 95.1 /100 | #93 | Exceptional 11.2% |
| Lithuanians | 94.8 /100 | #94 | Exceptional 11.3% |
| Carpatho Rusyns | 94.4 /100 | #95 | Exceptional 11.3% |
| Immigrants | Serbia | 94.4 /100 | #96 | Exceptional 11.3% |
| Nicaraguans | 94.3 /100 | #97 | Exceptional 11.3% |
| Estonians | 94.2 /100 | #98 | Exceptional 11.3% |
| Celtics | 94.0 /100 | #99 | Exceptional 11.3% |
| Pakistanis | 94.0 /100 | #100 | Exceptional 11.3% |
Demographics Similar to Taiwanese by Unemployment Among Youth under 25 years
In terms of unemployment among youth under 25 years, the demographic groups most similar to Taiwanese are European (10.8%, a difference of 0.22%), Slovene (10.7%, a difference of 0.26%), Osage (10.7%, a difference of 0.37%), Chinese (10.7%, a difference of 0.44%), and English (10.8%, a difference of 0.50%).
| Demographics | Rating | Rank | Unemployment Among Youth under 25 years |
| Immigrants | North Macedonia | 100.0 /100 | #25 | Exceptional 10.7% |
| Immigrants | India | 100.0 /100 | #26 | Exceptional 10.7% |
| Yugoslavians | 100.0 /100 | #27 | Exceptional 10.7% |
| Somalis | 100.0 /100 | #28 | Exceptional 10.7% |
| Chinese | 99.9 /100 | #29 | Exceptional 10.7% |
| Osage | 99.9 /100 | #30 | Exceptional 10.7% |
| Slovenes | 99.9 /100 | #31 | Exceptional 10.7% |
| Taiwanese | 99.9 /100 | #32 | Exceptional 10.8% |
| Europeans | 99.9 /100 | #33 | Exceptional 10.8% |
| English | 99.9 /100 | #34 | Exceptional 10.8% |
| Immigrants | Nepal | 99.9 /100 | #35 | Exceptional 10.8% |
| Hmong | 99.8 /100 | #36 | Exceptional 10.8% |
| Immigrants | Zimbabwe | 99.8 /100 | #37 | Exceptional 10.8% |
| Immigrants | Congo | 99.8 /100 | #38 | Exceptional 10.9% |
| Immigrants | Zaire | 99.8 /100 | #39 | Exceptional 10.9% |