British West Indian vs Immigrants from South America Unemployment Among Youth under 25 years
COMPARE
British West Indian
Immigrants from South America
Unemployment Among Youth under 25 years
Unemployment Among Youth under 25 years Comparison
British West Indians
Immigrants from South America
15.5%
UNEMPLOYMENT AMONG YOUTH UNDER 25 YEARS
0.0/ 100
METRIC RATING
327th/ 347
METRIC RANK
12.1%
UNEMPLOYMENT AMONG YOUTH UNDER 25 YEARS
1.8/ 100
METRIC RATING
231st/ 347
METRIC RANK
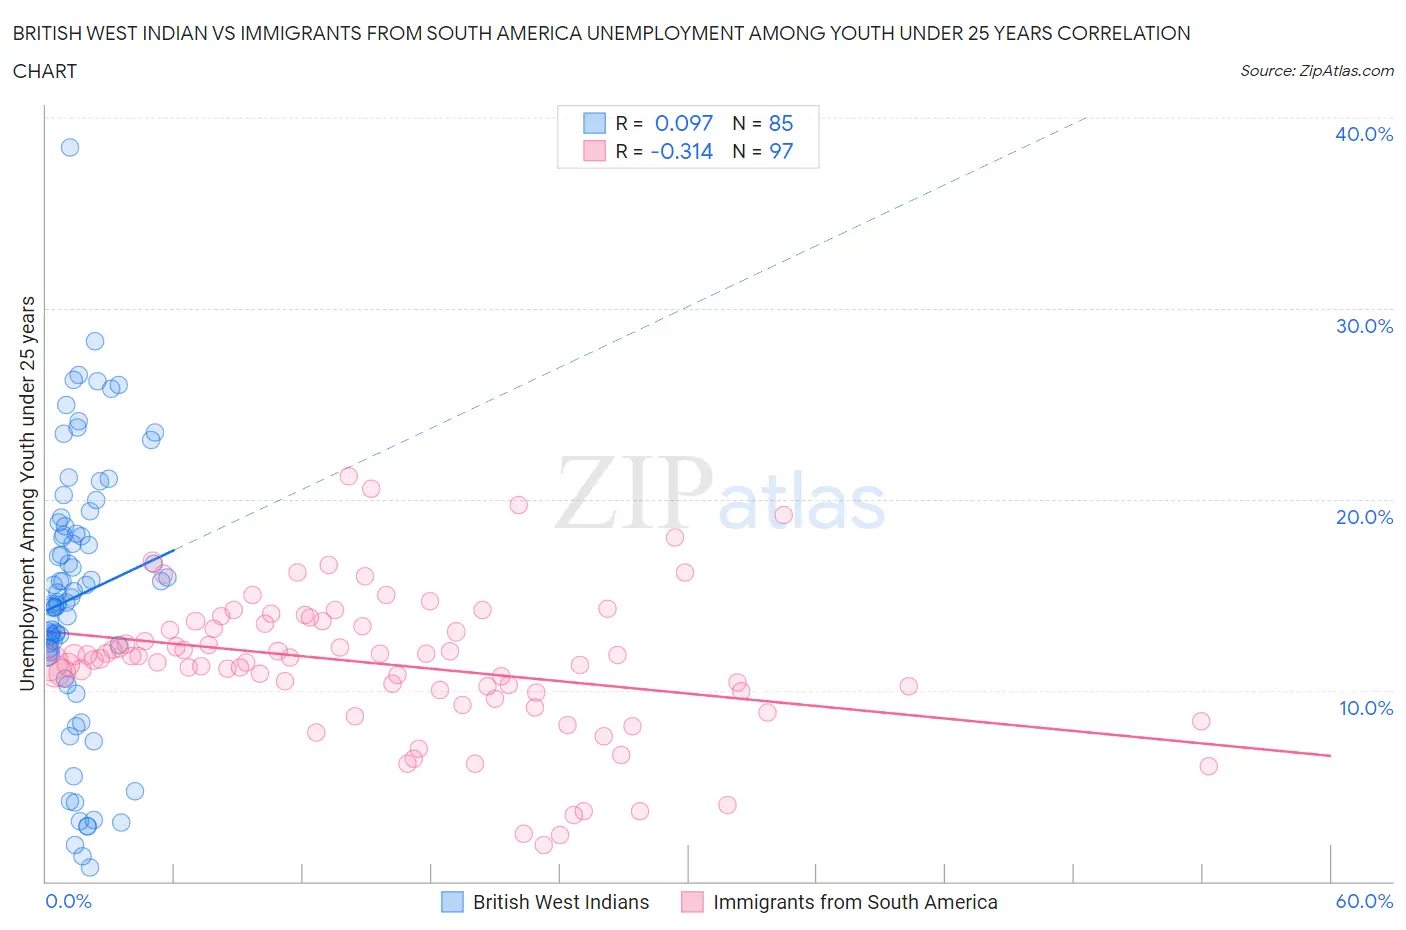
British West Indian vs Immigrants from South America Unemployment Among Youth under 25 years Correlation Chart
The statistical analysis conducted on geographies consisting of 152,199,351 people shows a slight positive correlation between the proportion of British West Indians and unemployment rate among youth under the age of 25 in the United States with a correlation coefficient (R) of 0.097 and weighted average of 15.5%. Similarly, the statistical analysis conducted on geographies consisting of 477,523,284 people shows a mild negative correlation between the proportion of Immigrants from South America and unemployment rate among youth under the age of 25 in the United States with a correlation coefficient (R) of -0.314 and weighted average of 12.1%, a difference of 28.6%.
Unemployment Among Youth under 25 years Correlation Summary
| Measurement | British West Indian | Immigrants from South America |
| Minimum | 0.70% | 1.9% |
| Maximum | 38.4% | 21.2% |
| Range | 37.7% | 19.3% |
| Mean | 14.9% | 11.4% |
| Median | 14.9% | 11.7% |
| Interquartile 25% (IQ1) | 12.0% | 9.9% |
| Interquartile 75% (IQ3) | 18.7% | 13.5% |
| Interquartile Range (IQR) | 6.7% | 3.6% |
| Standard Deviation (Sample) | 7.1% | 3.8% |
| Standard Deviation (Population) | 7.0% | 3.8% |
Similar Demographics by Unemployment Among Youth under 25 years
Demographics Similar to British West Indians by Unemployment Among Youth under 25 years
In terms of unemployment among youth under 25 years, the demographic groups most similar to British West Indians are Immigrants from Dominican Republic (15.6%, a difference of 0.11%), Immigrants from Yemen (15.6%, a difference of 0.24%), Yakama (15.6%, a difference of 0.28%), Dominican (15.7%, a difference of 1.1%), and Immigrants from Grenada (15.8%, a difference of 1.8%).
| Demographics | Rating | Rank | Unemployment Among Youth under 25 years |
| Barbadians | 0.0 /100 | #320 | Tragic 14.6% |
| Cheyenne | 0.0 /100 | #321 | Tragic 14.6% |
| Trinidadians and Tobagonians | 0.0 /100 | #322 | Tragic 14.6% |
| Immigrants | Trinidad and Tobago | 0.0 /100 | #323 | Tragic 14.6% |
| Immigrants | Jamaica | 0.0 /100 | #324 | Tragic 14.8% |
| Alaska Natives | 0.0 /100 | #325 | Tragic 14.9% |
| Immigrants | Barbados | 0.0 /100 | #326 | Tragic 15.2% |
| British West Indians | 0.0 /100 | #327 | Tragic 15.5% |
| Immigrants | Dominican Republic | 0.0 /100 | #328 | Tragic 15.6% |
| Immigrants | Yemen | 0.0 /100 | #329 | Tragic 15.6% |
| Yakama | 0.0 /100 | #330 | Tragic 15.6% |
| Dominicans | 0.0 /100 | #331 | Tragic 15.7% |
| Immigrants | Grenada | 0.0 /100 | #332 | Tragic 15.8% |
| Guyanese | 0.0 /100 | #333 | Tragic 15.9% |
| Immigrants | Guyana | 0.0 /100 | #334 | Tragic 15.9% |
Demographics Similar to Immigrants from South America by Unemployment Among Youth under 25 years
In terms of unemployment among youth under 25 years, the demographic groups most similar to Immigrants from South America are Immigrants from Belarus (12.1%, a difference of 0.070%), South American Indian (12.1%, a difference of 0.090%), Choctaw (12.1%, a difference of 0.10%), Moroccan (12.1%, a difference of 0.15%), and Immigrants from Fiji (12.1%, a difference of 0.16%).
| Demographics | Rating | Rank | Unemployment Among Youth under 25 years |
| Hawaiians | 3.5 /100 | #224 | Tragic 12.0% |
| Immigrants | Ukraine | 3.0 /100 | #225 | Tragic 12.0% |
| Immigrants | Israel | 2.6 /100 | #226 | Tragic 12.0% |
| Immigrants | Iran | 2.6 /100 | #227 | Tragic 12.0% |
| Immigrants | Fiji | 2.1 /100 | #228 | Tragic 12.1% |
| Moroccans | 2.1 /100 | #229 | Tragic 12.1% |
| Choctaw | 1.9 /100 | #230 | Tragic 12.1% |
| Immigrants | South America | 1.8 /100 | #231 | Tragic 12.1% |
| Immigrants | Belarus | 1.6 /100 | #232 | Tragic 12.1% |
| South American Indians | 1.6 /100 | #233 | Tragic 12.1% |
| Guatemalans | 1.4 /100 | #234 | Tragic 12.1% |
| Immigrants | Guatemala | 1.4 /100 | #235 | Tragic 12.1% |
| Immigrants | Immigrants | 1.3 /100 | #236 | Tragic 12.1% |
| Native Hawaiians | 1.3 /100 | #237 | Tragic 12.1% |
| Albanians | 1.2 /100 | #238 | Tragic 12.1% |