British West Indian vs Immigrants from Western Europe Unemployment Among Youth under 25 years
COMPARE
British West Indian
Immigrants from Western Europe
Unemployment Among Youth under 25 years
Unemployment Among Youth under 25 years Comparison
British West Indians
Immigrants from Western Europe
15.5%
UNEMPLOYMENT AMONG YOUTH UNDER 25 YEARS
0.0/ 100
METRIC RATING
327th/ 347
METRIC RANK
11.5%
UNEMPLOYMENT AMONG YOUTH UNDER 25 YEARS
64.7/ 100
METRIC RATING
159th/ 347
METRIC RANK
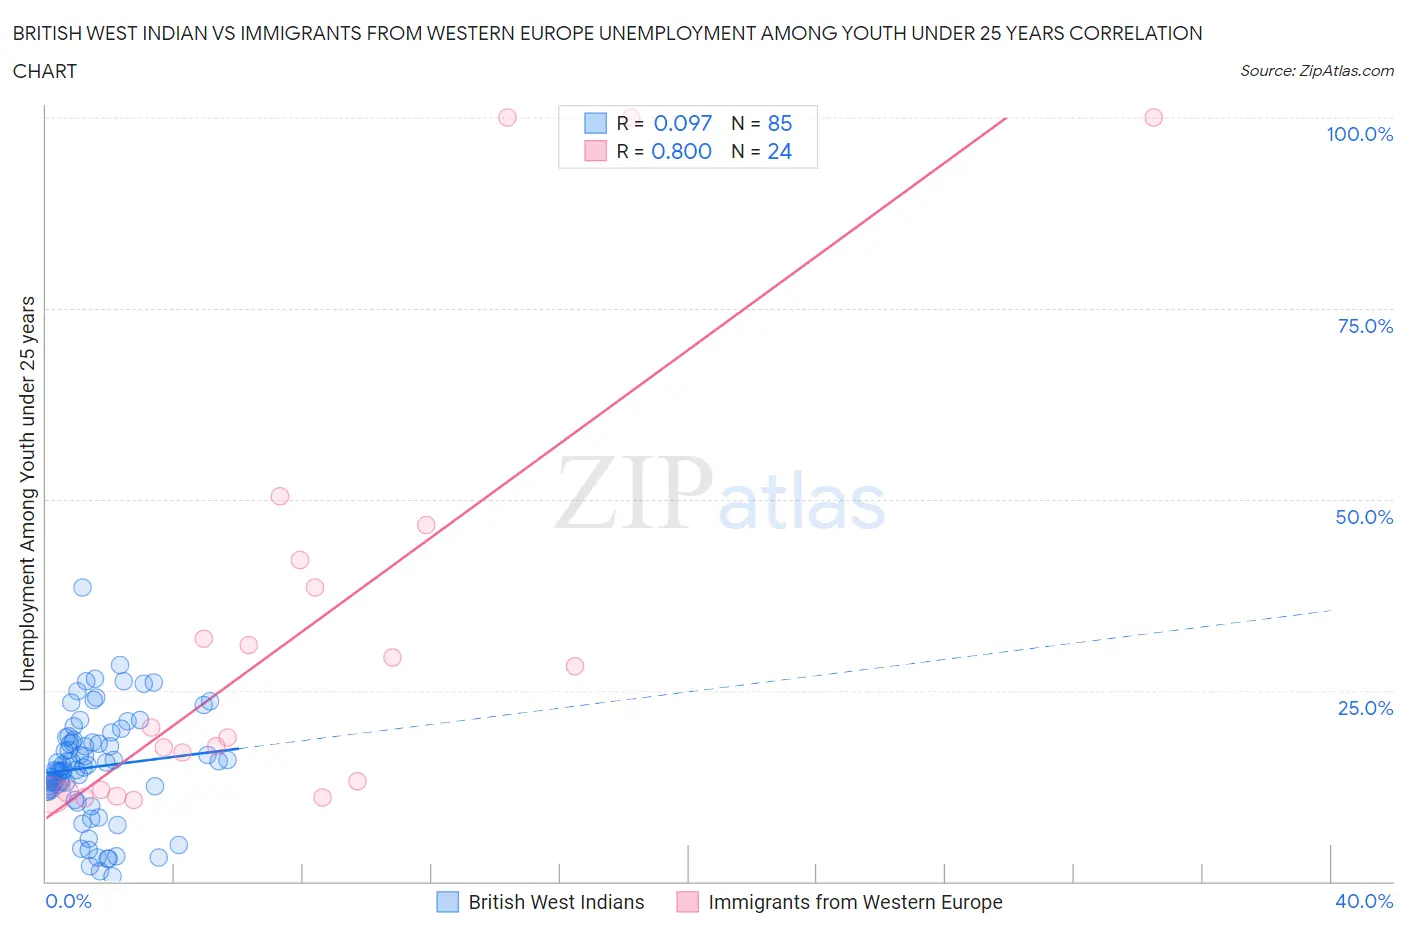
British West Indian vs Immigrants from Western Europe Unemployment Among Youth under 25 years Correlation Chart
The statistical analysis conducted on geographies consisting of 152,199,351 people shows a slight positive correlation between the proportion of British West Indians and unemployment rate among youth under the age of 25 in the United States with a correlation coefficient (R) of 0.097 and weighted average of 15.5%. Similarly, the statistical analysis conducted on geographies consisting of 482,819,626 people shows a very strong positive correlation between the proportion of Immigrants from Western Europe and unemployment rate among youth under the age of 25 in the United States with a correlation coefficient (R) of 0.800 and weighted average of 11.5%, a difference of 34.8%.
Unemployment Among Youth under 25 years Correlation Summary
| Measurement | British West Indian | Immigrants from Western Europe |
| Minimum | 0.70% | 10.7% |
| Maximum | 38.4% | 100.0% |
| Range | 37.7% | 89.3% |
| Mean | 14.9% | 32.5% |
| Median | 14.9% | 19.4% |
| Interquartile 25% (IQ1) | 12.0% | 11.9% |
| Interquartile 75% (IQ3) | 18.7% | 40.3% |
| Interquartile Range (IQR) | 6.7% | 28.4% |
| Standard Deviation (Sample) | 7.1% | 28.7% |
| Standard Deviation (Population) | 7.0% | 28.1% |
Similar Demographics by Unemployment Among Youth under 25 years
Demographics Similar to British West Indians by Unemployment Among Youth under 25 years
In terms of unemployment among youth under 25 years, the demographic groups most similar to British West Indians are Immigrants from Dominican Republic (15.6%, a difference of 0.11%), Immigrants from Yemen (15.6%, a difference of 0.24%), Yakama (15.6%, a difference of 0.28%), Dominican (15.7%, a difference of 1.1%), and Immigrants from Grenada (15.8%, a difference of 1.8%).
| Demographics | Rating | Rank | Unemployment Among Youth under 25 years |
| Barbadians | 0.0 /100 | #320 | Tragic 14.6% |
| Cheyenne | 0.0 /100 | #321 | Tragic 14.6% |
| Trinidadians and Tobagonians | 0.0 /100 | #322 | Tragic 14.6% |
| Immigrants | Trinidad and Tobago | 0.0 /100 | #323 | Tragic 14.6% |
| Immigrants | Jamaica | 0.0 /100 | #324 | Tragic 14.8% |
| Alaska Natives | 0.0 /100 | #325 | Tragic 14.9% |
| Immigrants | Barbados | 0.0 /100 | #326 | Tragic 15.2% |
| British West Indians | 0.0 /100 | #327 | Tragic 15.5% |
| Immigrants | Dominican Republic | 0.0 /100 | #328 | Tragic 15.6% |
| Immigrants | Yemen | 0.0 /100 | #329 | Tragic 15.6% |
| Yakama | 0.0 /100 | #330 | Tragic 15.6% |
| Dominicans | 0.0 /100 | #331 | Tragic 15.7% |
| Immigrants | Grenada | 0.0 /100 | #332 | Tragic 15.8% |
| Guyanese | 0.0 /100 | #333 | Tragic 15.9% |
| Immigrants | Guyana | 0.0 /100 | #334 | Tragic 15.9% |
Demographics Similar to Immigrants from Western Europe by Unemployment Among Youth under 25 years
In terms of unemployment among youth under 25 years, the demographic groups most similar to Immigrants from Western Europe are Immigrants from Turkey (11.5%, a difference of 0.0%), Immigrants from Eastern Asia (11.5%, a difference of 0.010%), Indian (Asian) (11.5%, a difference of 0.020%), Ukrainian (11.5%, a difference of 0.020%), and Immigrants from Germany (11.5%, a difference of 0.050%).
| Demographics | Rating | Rank | Unemployment Among Youth under 25 years |
| Iraqis | 68.3 /100 | #152 | Good 11.5% |
| Immigrants | Czechoslovakia | 67.1 /100 | #153 | Good 11.5% |
| Immigrants | Asia | 66.7 /100 | #154 | Good 11.5% |
| Immigrants | Romania | 66.3 /100 | #155 | Good 11.5% |
| Immigrants | Germany | 65.9 /100 | #156 | Good 11.5% |
| Indians (Asian) | 65.1 /100 | #157 | Good 11.5% |
| Immigrants | Turkey | 64.8 /100 | #158 | Good 11.5% |
| Immigrants | Western Europe | 64.7 /100 | #159 | Good 11.5% |
| Immigrants | Eastern Asia | 64.5 /100 | #160 | Good 11.5% |
| Ukrainians | 64.3 /100 | #161 | Good 11.5% |
| Immigrants | Northern Africa | 62.7 /100 | #162 | Good 11.5% |
| Immigrants | Kazakhstan | 62.7 /100 | #163 | Good 11.5% |
| Immigrants | Laos | 62.4 /100 | #164 | Good 11.5% |
| Immigrants | Sweden | 61.3 /100 | #165 | Good 11.5% |
| Spanish | 60.3 /100 | #166 | Good 11.6% |