Latvian vs Taiwanese Unemployment Among Youth under 25 years
COMPARE
Latvian
Taiwanese
Unemployment Among Youth under 25 years
Unemployment Among Youth under 25 years Comparison
Latvians
Taiwanese
11.0%
UNEMPLOYMENT AMONG YOUTH UNDER 25 YEARS
99.0/ 100
METRIC RATING
52nd/ 347
METRIC RANK
10.8%
UNEMPLOYMENT AMONG YOUTH UNDER 25 YEARS
99.9/ 100
METRIC RATING
32nd/ 347
METRIC RANK
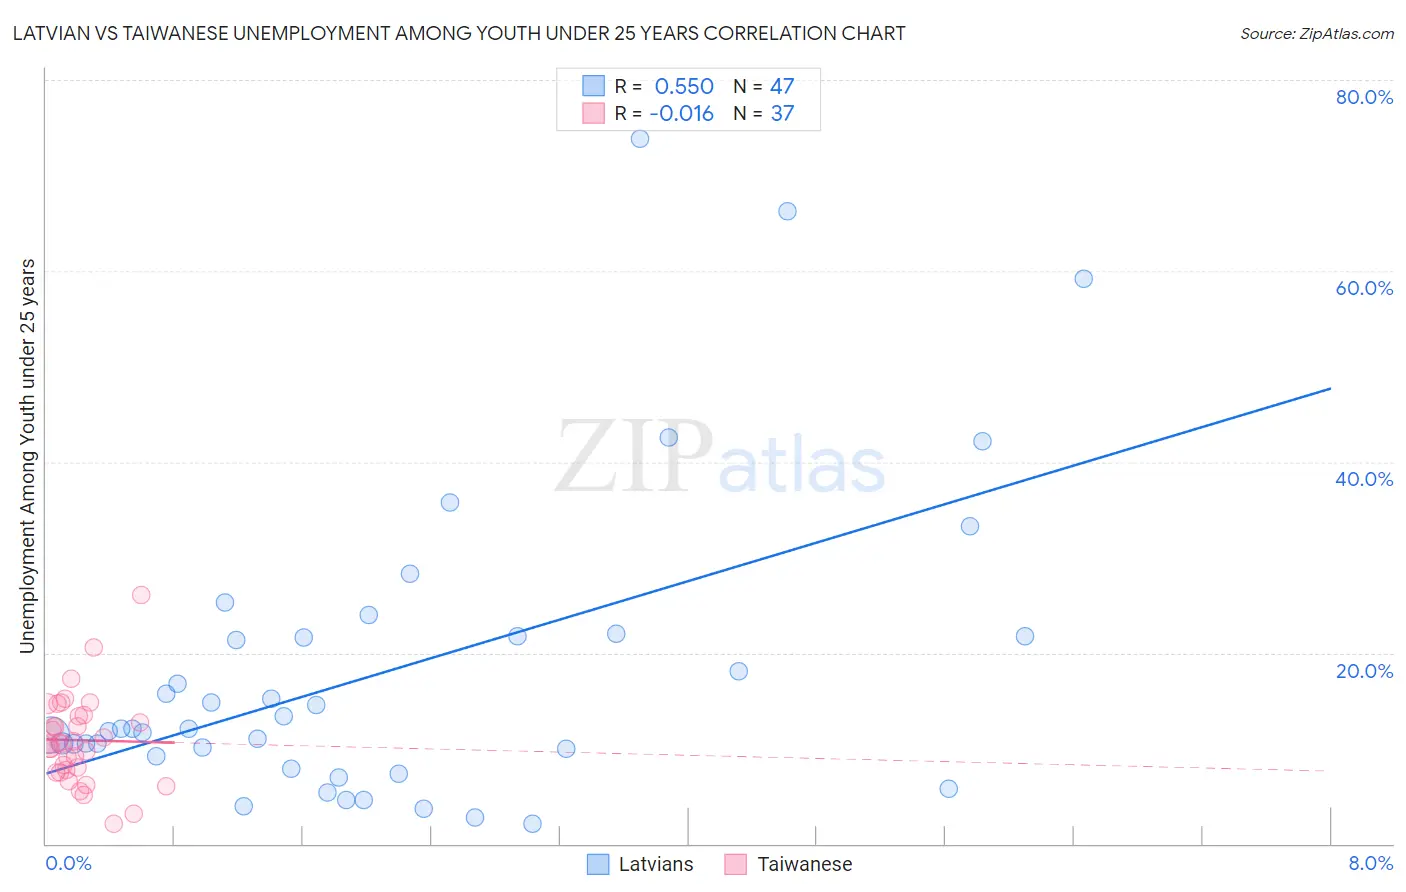
Latvian vs Taiwanese Unemployment Among Youth under 25 years Correlation Chart
The statistical analysis conducted on geographies consisting of 218,853,082 people shows a substantial positive correlation between the proportion of Latvians and unemployment rate among youth under the age of 25 in the United States with a correlation coefficient (R) of 0.550 and weighted average of 11.0%. Similarly, the statistical analysis conducted on geographies consisting of 31,706,406 people shows no correlation between the proportion of Taiwanese and unemployment rate among youth under the age of 25 in the United States with a correlation coefficient (R) of -0.016 and weighted average of 10.8%, a difference of 2.8%.
Unemployment Among Youth under 25 years Correlation Summary
| Measurement | Latvian | Taiwanese |
| Minimum | 2.1% | 2.1% |
| Maximum | 73.8% | 26.1% |
| Range | 71.7% | 24.0% |
| Mean | 18.2% | 10.8% |
| Median | 12.1% | 10.5% |
| Interquartile 25% (IQ1) | 9.1% | 7.6% |
| Interquartile 75% (IQ3) | 21.8% | 13.4% |
| Interquartile Range (IQR) | 12.7% | 5.8% |
| Standard Deviation (Sample) | 16.0% | 4.7% |
| Standard Deviation (Population) | 15.8% | 4.6% |
Demographics Similar to Latvians and Taiwanese by Unemployment Among Youth under 25 years
In terms of unemployment among youth under 25 years, the demographic groups most similar to Latvians are Serbian (11.0%, a difference of 0.020%), Czechoslovakian (11.0%, a difference of 0.25%), Thai (11.0%, a difference of 0.34%), Polish (11.0%, a difference of 0.42%), and Australian (10.9%, a difference of 0.98%). Similarly, the demographic groups most similar to Taiwanese are European (10.8%, a difference of 0.22%), English (10.8%, a difference of 0.50%), Immigrants from Nepal (10.8%, a difference of 0.57%), Hmong (10.8%, a difference of 0.70%), and Immigrants from Zimbabwe (10.8%, a difference of 0.86%).
| Demographics | Rating | Rank | Unemployment Among Youth under 25 years |
| Taiwanese | 99.9 /100 | #32 | Exceptional 10.8% |
| Europeans | 99.9 /100 | #33 | Exceptional 10.8% |
| English | 99.9 /100 | #34 | Exceptional 10.8% |
| Immigrants | Nepal | 99.9 /100 | #35 | Exceptional 10.8% |
| Hmong | 99.8 /100 | #36 | Exceptional 10.8% |
| Immigrants | Zimbabwe | 99.8 /100 | #37 | Exceptional 10.8% |
| Immigrants | Congo | 99.8 /100 | #38 | Exceptional 10.9% |
| Immigrants | Zaire | 99.8 /100 | #39 | Exceptional 10.9% |
| Scottish | 99.8 /100 | #40 | Exceptional 10.9% |
| Croatians | 99.8 /100 | #41 | Exceptional 10.9% |
| Cambodians | 99.7 /100 | #42 | Exceptional 10.9% |
| British | 99.7 /100 | #43 | Exceptional 10.9% |
| Welsh | 99.7 /100 | #44 | Exceptional 10.9% |
| Bulgarians | 99.6 /100 | #45 | Exceptional 10.9% |
| Tongans | 99.6 /100 | #46 | Exceptional 10.9% |
| Australians | 99.6 /100 | #47 | Exceptional 10.9% |
| Poles | 99.3 /100 | #48 | Exceptional 11.0% |
| Thais | 99.3 /100 | #49 | Exceptional 11.0% |
| Czechoslovakians | 99.2 /100 | #50 | Exceptional 11.0% |
| Serbians | 99.0 /100 | #51 | Exceptional 11.0% |
| Latvians | 99.0 /100 | #52 | Exceptional 11.0% |