Cheyenne vs Paiute Unemployment Among Youth under 25 years
COMPARE
Cheyenne
Paiute
Unemployment Among Youth under 25 years
Unemployment Among Youth under 25 years Comparison
Cheyenne
Paiute
14.6%
UNEMPLOYMENT AMONG YOUTH UNDER 25 YEARS
0.0/ 100
METRIC RATING
321st/ 347
METRIC RANK
17.6%
UNEMPLOYMENT AMONG YOUTH UNDER 25 YEARS
0.0/ 100
METRIC RATING
341st/ 347
METRIC RANK
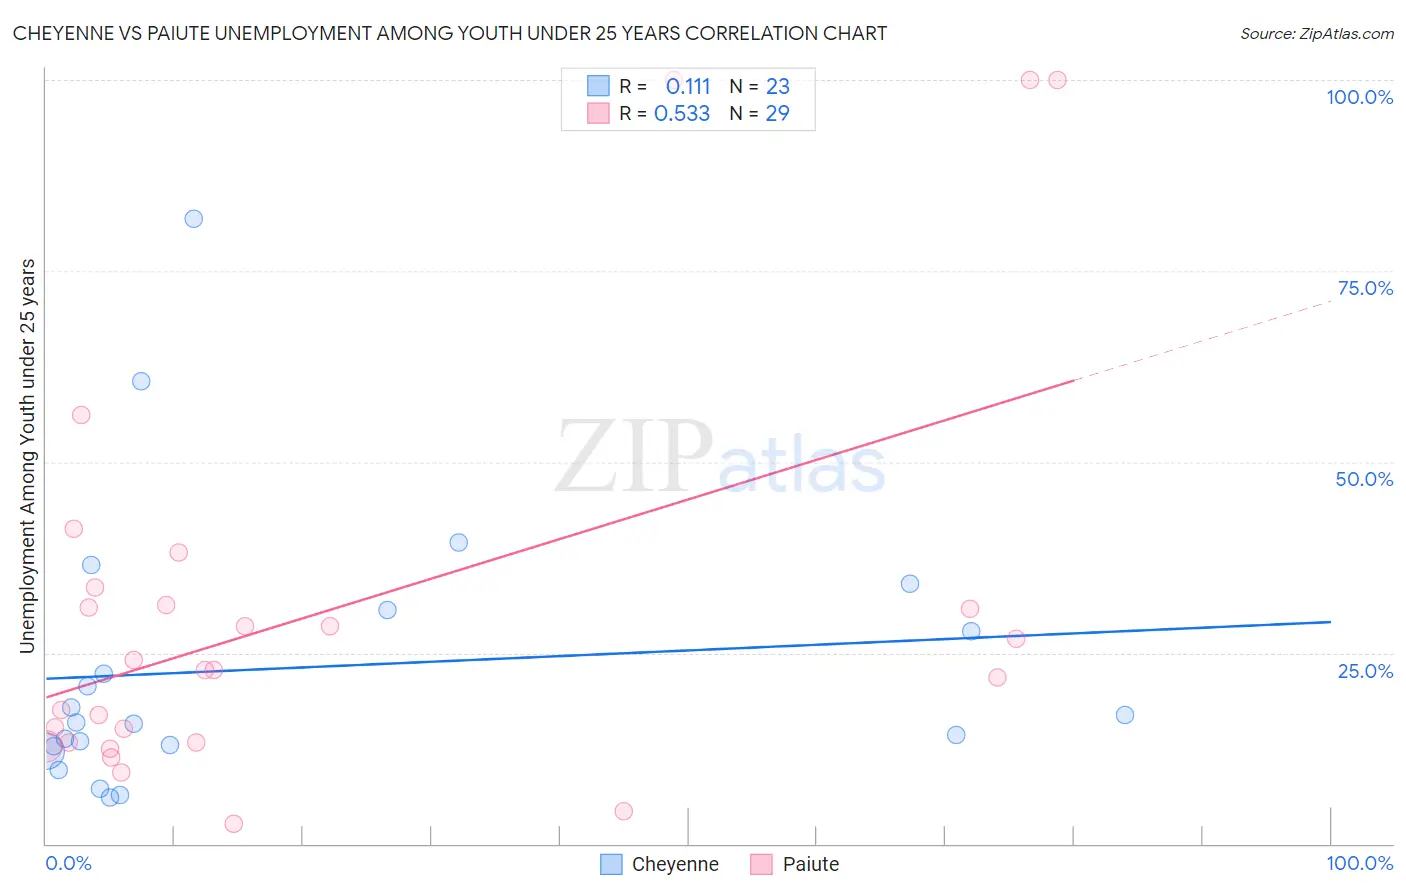
Cheyenne vs Paiute Unemployment Among Youth under 25 years Correlation Chart
The statistical analysis conducted on geographies consisting of 80,351,634 people shows a poor positive correlation between the proportion of Cheyenne and unemployment rate among youth under the age of 25 in the United States with a correlation coefficient (R) of 0.111 and weighted average of 14.6%. Similarly, the statistical analysis conducted on geographies consisting of 58,170,171 people shows a substantial positive correlation between the proportion of Paiute and unemployment rate among youth under the age of 25 in the United States with a correlation coefficient (R) of 0.533 and weighted average of 17.6%, a difference of 20.2%.
Unemployment Among Youth under 25 years Correlation Summary
| Measurement | Cheyenne | Paiute |
| Minimum | 6.1% | 2.7% |
| Maximum | 81.8% | 100.0% |
| Range | 75.7% | 97.3% |
| Mean | 23.0% | 30.4% |
| Median | 15.9% | 22.8% |
| Interquartile 25% (IQ1) | 12.8% | 13.3% |
| Interquartile 75% (IQ3) | 30.6% | 32.4% |
| Interquartile Range (IQR) | 17.8% | 19.1% |
| Standard Deviation (Sample) | 18.2% | 26.7% |
| Standard Deviation (Population) | 17.8% | 26.2% |
Demographics Similar to Cheyenne and Paiute by Unemployment Among Youth under 25 years
In terms of unemployment among youth under 25 years, the demographic groups most similar to Cheyenne are Trinidadian and Tobagonian (14.6%, a difference of 0.070%), Immigrants from Trinidad and Tobago (14.6%, a difference of 0.16%), Immigrants from Jamaica (14.8%, a difference of 1.3%), Alaska Native (14.9%, a difference of 2.0%), and Immigrants from Barbados (15.2%, a difference of 4.2%). Similarly, the demographic groups most similar to Paiute are Colville (16.8%, a difference of 4.8%), Tsimshian (16.5%, a difference of 6.5%), Yuman (16.3%, a difference of 7.6%), Arapaho (16.3%, a difference of 7.9%), and Pima (16.2%, a difference of 8.1%).
| Demographics | Rating | Rank | Unemployment Among Youth under 25 years |
| Cheyenne | 0.0 /100 | #321 | Tragic 14.6% |
| Trinidadians and Tobagonians | 0.0 /100 | #322 | Tragic 14.6% |
| Immigrants | Trinidad and Tobago | 0.0 /100 | #323 | Tragic 14.6% |
| Immigrants | Jamaica | 0.0 /100 | #324 | Tragic 14.8% |
| Alaska Natives | 0.0 /100 | #325 | Tragic 14.9% |
| Immigrants | Barbados | 0.0 /100 | #326 | Tragic 15.2% |
| British West Indians | 0.0 /100 | #327 | Tragic 15.5% |
| Immigrants | Dominican Republic | 0.0 /100 | #328 | Tragic 15.6% |
| Immigrants | Yemen | 0.0 /100 | #329 | Tragic 15.6% |
| Yakama | 0.0 /100 | #330 | Tragic 15.6% |
| Dominicans | 0.0 /100 | #331 | Tragic 15.7% |
| Immigrants | Grenada | 0.0 /100 | #332 | Tragic 15.8% |
| Guyanese | 0.0 /100 | #333 | Tragic 15.9% |
| Immigrants | Guyana | 0.0 /100 | #334 | Tragic 15.9% |
| Immigrants | St. Vincent and the Grenadines | 0.0 /100 | #335 | Tragic 16.1% |
| Pima | 0.0 /100 | #336 | Tragic 16.2% |
| Arapaho | 0.0 /100 | #337 | Tragic 16.3% |
| Yuman | 0.0 /100 | #338 | Tragic 16.3% |
| Tsimshian | 0.0 /100 | #339 | Tragic 16.5% |
| Colville | 0.0 /100 | #340 | Tragic 16.8% |
| Paiute | 0.0 /100 | #341 | Tragic 17.6% |