British West Indian vs Immigrants from Uruguay Unemployment Among Ages 30 to 34 years
COMPARE
British West Indian
Immigrants from Uruguay
Unemployment Among Ages 30 to 34 years
Unemployment Among Ages 30 to 34 years Comparison
British West Indians
Immigrants from Uruguay
7.0%
UNEMPLOYMENT AMONG AGES 30 TO 34 YEARS
0.0/ 100
METRIC RATING
312th/ 347
METRIC RANK
5.3%
UNEMPLOYMENT AMONG AGES 30 TO 34 YEARS
79.3/ 100
METRIC RATING
128th/ 347
METRIC RANK
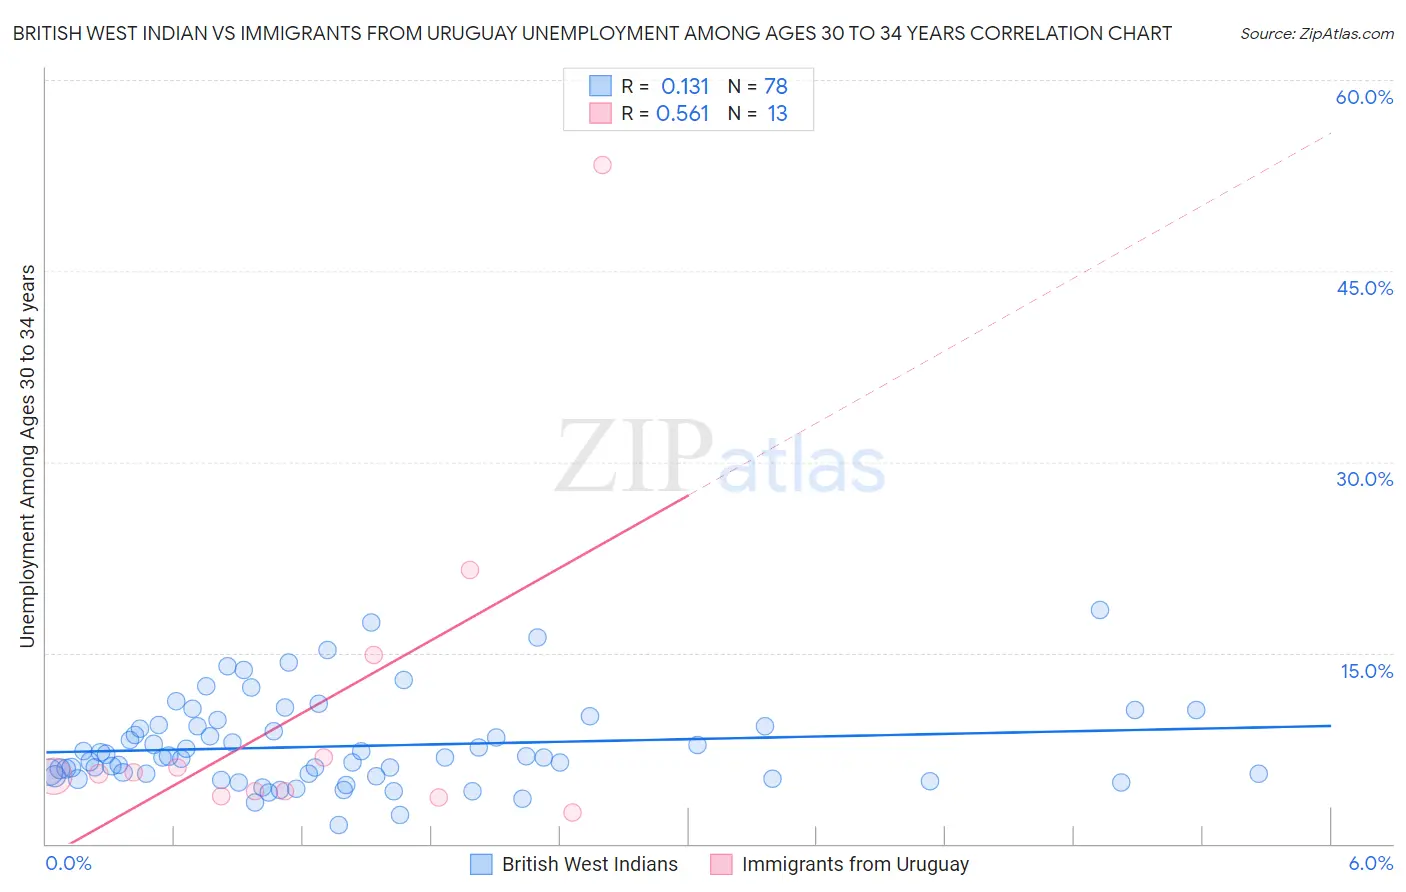
British West Indian vs Immigrants from Uruguay Unemployment Among Ages 30 to 34 years Correlation Chart
The statistical analysis conducted on geographies consisting of 149,857,863 people shows a poor positive correlation between the proportion of British West Indians and unemployment rate among population between the ages 30 and 34 in the United States with a correlation coefficient (R) of 0.131 and weighted average of 7.0%. Similarly, the statistical analysis conducted on geographies consisting of 130,935,949 people shows a substantial positive correlation between the proportion of Immigrants from Uruguay and unemployment rate among population between the ages 30 and 34 in the United States with a correlation coefficient (R) of 0.561 and weighted average of 5.3%, a difference of 32.0%.
Unemployment Among Ages 30 to 34 years Correlation Summary
| Measurement | British West Indian | Immigrants from Uruguay |
| Minimum | 1.5% | 2.5% |
| Maximum | 18.4% | 53.3% |
| Range | 16.9% | 50.8% |
| Mean | 7.7% | 10.5% |
| Median | 6.8% | 5.5% |
| Interquartile 25% (IQ1) | 5.3% | 3.9% |
| Interquartile 75% (IQ3) | 9.2% | 10.8% |
| Interquartile Range (IQR) | 3.9% | 6.9% |
| Standard Deviation (Sample) | 3.4% | 13.9% |
| Standard Deviation (Population) | 3.4% | 13.4% |
Similar Demographics by Unemployment Among Ages 30 to 34 years
Demographics Similar to British West Indians by Unemployment Among Ages 30 to 34 years
In terms of unemployment among ages 30 to 34 years, the demographic groups most similar to British West Indians are Ute (7.0%, a difference of 0.040%), Alaskan Athabascan (7.0%, a difference of 0.070%), Lumbee (7.1%, a difference of 0.25%), Aleut (7.1%, a difference of 0.62%), and Immigrants from St. Vincent and the Grenadines (7.0%, a difference of 1.1%).
| Demographics | Rating | Rank | Unemployment Among Ages 30 to 34 years |
| Paiute | 0.0 /100 | #305 | Tragic 6.7% |
| Immigrants | Armenia | 0.0 /100 | #306 | Tragic 6.8% |
| Immigrants | Belize | 0.0 /100 | #307 | Tragic 6.9% |
| Immigrants | Azores | 0.0 /100 | #308 | Tragic 6.9% |
| Immigrants | Grenada | 0.0 /100 | #309 | Tragic 6.9% |
| Immigrants | St. Vincent and the Grenadines | 0.0 /100 | #310 | Tragic 7.0% |
| Alaskan Athabascans | 0.0 /100 | #311 | Tragic 7.0% |
| British West Indians | 0.0 /100 | #312 | Tragic 7.0% |
| Ute | 0.0 /100 | #313 | Tragic 7.0% |
| Lumbee | 0.0 /100 | #314 | Tragic 7.1% |
| Aleuts | 0.0 /100 | #315 | Tragic 7.1% |
| Houma | 0.0 /100 | #316 | Tragic 7.2% |
| Immigrants | Cabo Verde | 0.0 /100 | #317 | Tragic 7.2% |
| Blacks/African Americans | 0.0 /100 | #318 | Tragic 7.2% |
| Guyanese | 0.0 /100 | #319 | Tragic 7.2% |
Demographics Similar to Immigrants from Uruguay by Unemployment Among Ages 30 to 34 years
In terms of unemployment among ages 30 to 34 years, the demographic groups most similar to Immigrants from Uruguay are Taiwanese (5.3%, a difference of 0.020%), Polish (5.3%, a difference of 0.060%), Immigrants from Sri Lanka (5.3%, a difference of 0.10%), Greek (5.3%, a difference of 0.12%), and German (5.3%, a difference of 0.16%).
| Demographics | Rating | Rank | Unemployment Among Ages 30 to 34 years |
| Romanians | 82.3 /100 | #121 | Excellent 5.3% |
| Immigrants | Netherlands | 81.8 /100 | #122 | Excellent 5.3% |
| Immigrants | Italy | 81.1 /100 | #123 | Excellent 5.3% |
| Immigrants | Brazil | 80.8 /100 | #124 | Excellent 5.3% |
| Greeks | 80.4 /100 | #125 | Excellent 5.3% |
| Immigrants | Sri Lanka | 80.2 /100 | #126 | Excellent 5.3% |
| Taiwanese | 79.4 /100 | #127 | Good 5.3% |
| Immigrants | Uruguay | 79.3 /100 | #128 | Good 5.3% |
| Poles | 78.8 /100 | #129 | Good 5.3% |
| Germans | 77.8 /100 | #130 | Good 5.3% |
| Immigrants | Eastern Europe | 77.4 /100 | #131 | Good 5.3% |
| Carpatho Rusyns | 77.3 /100 | #132 | Good 5.3% |
| Immigrants | Northern Europe | 77.3 /100 | #133 | Good 5.3% |
| Bangladeshis | 76.6 /100 | #134 | Good 5.3% |
| Palestinians | 75.1 /100 | #135 | Good 5.4% |