Somali vs Immigrants from Switzerland Female Unemployment
COMPARE
Somali
Immigrants from Switzerland
Female Unemployment
Female Unemployment Comparison
Somalis
Immigrants from Switzerland
5.0%
FEMALE UNEMPLOYMENT
94.6/ 100
METRIC RATING
103rd/ 347
METRIC RANK
5.1%
FEMALE UNEMPLOYMENT
93.1/ 100
METRIC RATING
107th/ 347
METRIC RANK
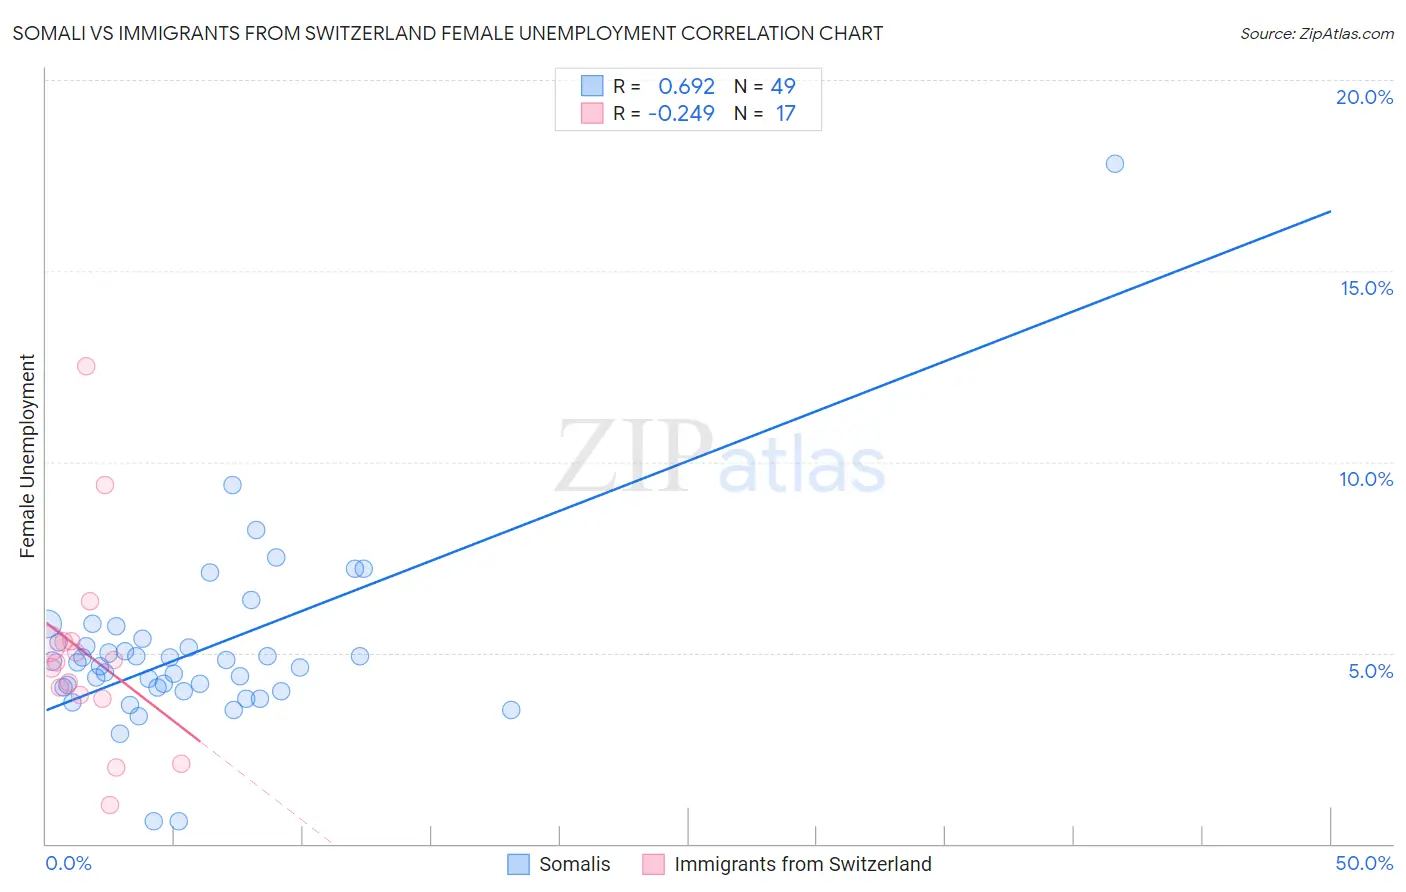
Somali vs Immigrants from Switzerland Female Unemployment Correlation Chart
The statistical analysis conducted on geographies consisting of 99,208,507 people shows a significant positive correlation between the proportion of Somalis and unemploymnet rate among females in the United States with a correlation coefficient (R) of 0.692 and weighted average of 5.0%. Similarly, the statistical analysis conducted on geographies consisting of 147,831,488 people shows a weak negative correlation between the proportion of Immigrants from Switzerland and unemploymnet rate among females in the United States with a correlation coefficient (R) of -0.249 and weighted average of 5.1%, a difference of 0.40%.
Female Unemployment Correlation Summary
| Measurement | Somali | Immigrants from Switzerland |
| Minimum | 0.60% | 1.0% |
| Maximum | 17.8% | 12.5% |
| Range | 17.2% | 11.5% |
| Mean | 5.0% | 5.0% |
| Median | 4.8% | 4.7% |
| Interquartile 25% (IQ1) | 4.0% | 3.8% |
| Interquartile 75% (IQ3) | 5.3% | 5.3% |
| Interquartile Range (IQR) | 1.3% | 1.4% |
| Standard Deviation (Sample) | 2.4% | 2.7% |
| Standard Deviation (Population) | 2.4% | 2.6% |
Demographics Similar to Somalis and Immigrants from Switzerland by Female Unemployment
In terms of female unemployment, the demographic groups most similar to Somalis are Immigrants from Kenya (5.0%, a difference of 0.080%), Immigrants from Czechoslovakia (5.0%, a difference of 0.13%), Indonesian (5.0%, a difference of 0.17%), Immigrants from Zaire (5.0%, a difference of 0.19%), and Immigrants from Somalia (5.0%, a difference of 0.20%). Similarly, the demographic groups most similar to Immigrants from Switzerland are Puget Sound Salish (5.1%, a difference of 0.020%), Paraguayan (5.1%, a difference of 0.030%), Immigrants from Eastern Africa (5.1%, a difference of 0.060%), Immigrants from England (5.0%, a difference of 0.12%), and Kenyan (5.0%, a difference of 0.15%).
| Demographics | Rating | Rank | Female Unemployment |
| Burmese | 95.6 /100 | #95 | Exceptional 5.0% |
| Immigrants | South Central Asia | 95.5 /100 | #96 | Exceptional 5.0% |
| Immigrants | Somalia | 95.2 /100 | #97 | Exceptional 5.0% |
| Immigrants | Kuwait | 95.2 /100 | #98 | Exceptional 5.0% |
| Immigrants | Zaire | 95.2 /100 | #99 | Exceptional 5.0% |
| Indonesians | 95.1 /100 | #100 | Exceptional 5.0% |
| Immigrants | Czechoslovakia | 95.0 /100 | #101 | Exceptional 5.0% |
| Immigrants | Kenya | 94.8 /100 | #102 | Exceptional 5.0% |
| Somalis | 94.6 /100 | #103 | Exceptional 5.0% |
| Kenyans | 93.7 /100 | #104 | Exceptional 5.0% |
| Immigrants | England | 93.6 /100 | #105 | Exceptional 5.0% |
| Paraguayans | 93.2 /100 | #106 | Exceptional 5.1% |
| Immigrants | Switzerland | 93.1 /100 | #107 | Exceptional 5.1% |
| Puget Sound Salish | 93.0 /100 | #108 | Exceptional 5.1% |
| Immigrants | Eastern Africa | 92.8 /100 | #109 | Exceptional 5.1% |
| Macedonians | 92.4 /100 | #110 | Exceptional 5.1% |
| Immigrants | Burma/Myanmar | 92.3 /100 | #111 | Exceptional 5.1% |
| Estonians | 92.1 /100 | #112 | Exceptional 5.1% |
| Immigrants | Saudi Arabia | 91.2 /100 | #113 | Exceptional 5.1% |
| Immigrants | Turkey | 91.0 /100 | #114 | Exceptional 5.1% |
| Lebanese | 91.0 /100 | #115 | Exceptional 5.1% |