Kenyan vs Immigrants from Russia Female Unemployment
COMPARE
Kenyan
Immigrants from Russia
Female Unemployment
Female Unemployment Comparison
Kenyans
Immigrants from Russia
5.0%
FEMALE UNEMPLOYMENT
93.7/ 100
METRIC RATING
104th/ 347
METRIC RANK
5.2%
FEMALE UNEMPLOYMENT
69.3/ 100
METRIC RATING
157th/ 347
METRIC RANK
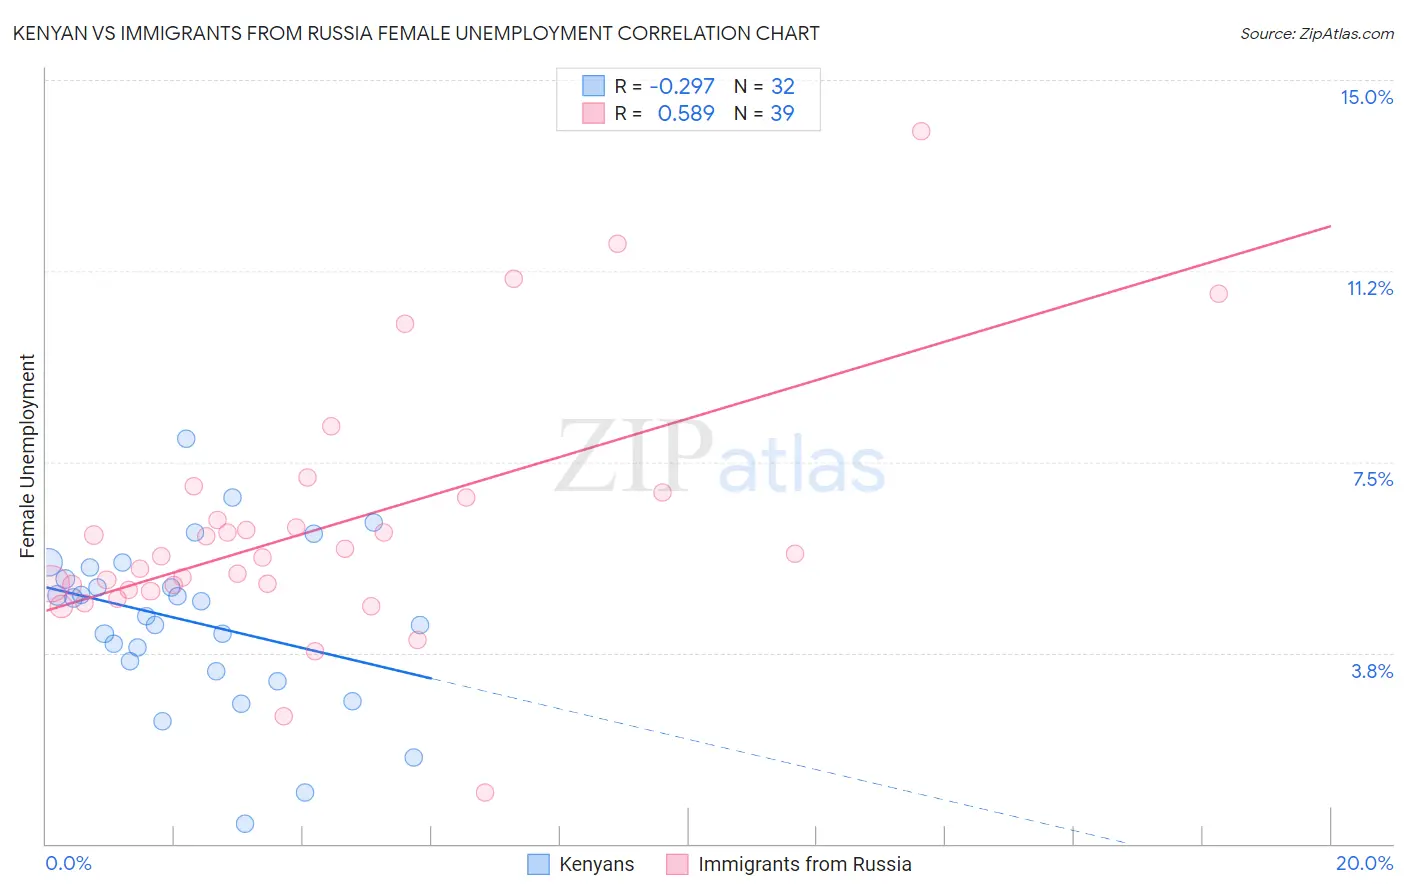
Kenyan vs Immigrants from Russia Female Unemployment Correlation Chart
The statistical analysis conducted on geographies consisting of 168,081,241 people shows a weak negative correlation between the proportion of Kenyans and unemploymnet rate among females in the United States with a correlation coefficient (R) of -0.297 and weighted average of 5.0%. Similarly, the statistical analysis conducted on geographies consisting of 346,554,510 people shows a substantial positive correlation between the proportion of Immigrants from Russia and unemploymnet rate among females in the United States with a correlation coefficient (R) of 0.589 and weighted average of 5.2%, a difference of 2.9%.
Female Unemployment Correlation Summary
| Measurement | Kenyan | Immigrants from Russia |
| Minimum | 0.40% | 1.0% |
| Maximum | 7.9% | 14.0% |
| Range | 7.5% | 13.0% |
| Mean | 4.4% | 6.2% |
| Median | 4.6% | 5.7% |
| Interquartile 25% (IQ1) | 3.5% | 5.0% |
| Interquartile 75% (IQ3) | 5.3% | 6.8% |
| Interquartile Range (IQR) | 1.8% | 1.8% |
| Standard Deviation (Sample) | 1.6% | 2.5% |
| Standard Deviation (Population) | 1.6% | 2.4% |
Similar Demographics by Female Unemployment
Demographics Similar to Kenyans by Female Unemployment
In terms of female unemployment, the demographic groups most similar to Kenyans are Immigrants from England (5.0%, a difference of 0.020%), Paraguayan (5.1%, a difference of 0.12%), Immigrants from Switzerland (5.1%, a difference of 0.15%), Puget Sound Salish (5.1%, a difference of 0.17%), and Immigrants from Eastern Africa (5.1%, a difference of 0.21%).
| Demographics | Rating | Rank | Female Unemployment |
| Immigrants | Somalia | 95.2 /100 | #97 | Exceptional 5.0% |
| Immigrants | Kuwait | 95.2 /100 | #98 | Exceptional 5.0% |
| Immigrants | Zaire | 95.2 /100 | #99 | Exceptional 5.0% |
| Indonesians | 95.1 /100 | #100 | Exceptional 5.0% |
| Immigrants | Czechoslovakia | 95.0 /100 | #101 | Exceptional 5.0% |
| Immigrants | Kenya | 94.8 /100 | #102 | Exceptional 5.0% |
| Somalis | 94.6 /100 | #103 | Exceptional 5.0% |
| Kenyans | 93.7 /100 | #104 | Exceptional 5.0% |
| Immigrants | England | 93.6 /100 | #105 | Exceptional 5.0% |
| Paraguayans | 93.2 /100 | #106 | Exceptional 5.1% |
| Immigrants | Switzerland | 93.1 /100 | #107 | Exceptional 5.1% |
| Puget Sound Salish | 93.0 /100 | #108 | Exceptional 5.1% |
| Immigrants | Eastern Africa | 92.8 /100 | #109 | Exceptional 5.1% |
| Macedonians | 92.4 /100 | #110 | Exceptional 5.1% |
| Immigrants | Burma/Myanmar | 92.3 /100 | #111 | Exceptional 5.1% |
Demographics Similar to Immigrants from Russia by Female Unemployment
In terms of female unemployment, the demographic groups most similar to Immigrants from Russia are Immigrants from Northern Africa (5.2%, a difference of 0.020%), Immigrants from Egypt (5.2%, a difference of 0.050%), Albanian (5.2%, a difference of 0.070%), South African (5.2%, a difference of 0.10%), and Immigrants from Micronesia (5.2%, a difference of 0.17%).
| Demographics | Rating | Rank | Female Unemployment |
| Egyptians | 78.3 /100 | #150 | Good 5.2% |
| Immigrants | China | 75.9 /100 | #151 | Good 5.2% |
| Immigrants | Italy | 75.0 /100 | #152 | Good 5.2% |
| Immigrants | Greece | 74.9 /100 | #153 | Good 5.2% |
| South Africans | 70.8 /100 | #154 | Good 5.2% |
| Immigrants | Egypt | 70.0 /100 | #155 | Good 5.2% |
| Immigrants | Northern Africa | 69.6 /100 | #156 | Good 5.2% |
| Immigrants | Russia | 69.3 /100 | #157 | Good 5.2% |
| Albanians | 68.3 /100 | #158 | Good 5.2% |
| Immigrants | Micronesia | 66.9 /100 | #159 | Good 5.2% |
| Immigrants | Spain | 66.8 /100 | #160 | Good 5.2% |
| Immigrants | Pakistan | 66.7 /100 | #161 | Good 5.2% |
| Potawatomi | 65.9 /100 | #162 | Good 5.2% |
| Immigrants | Asia | 64.3 /100 | #163 | Good 5.2% |
| Bangladeshis | 64.3 /100 | #164 | Good 5.2% |