Immigrants from Croatia vs Salvadoran Male Unemployment
COMPARE
Immigrants from Croatia
Salvadoran
Male Unemployment
Male Unemployment Comparison
Immigrants from Croatia
Salvadorans
5.2%
MALE UNEMPLOYMENT
79.7/ 100
METRIC RATING
138th/ 347
METRIC RANK
5.7%
MALE UNEMPLOYMENT
1.0/ 100
METRIC RATING
241st/ 347
METRIC RANK
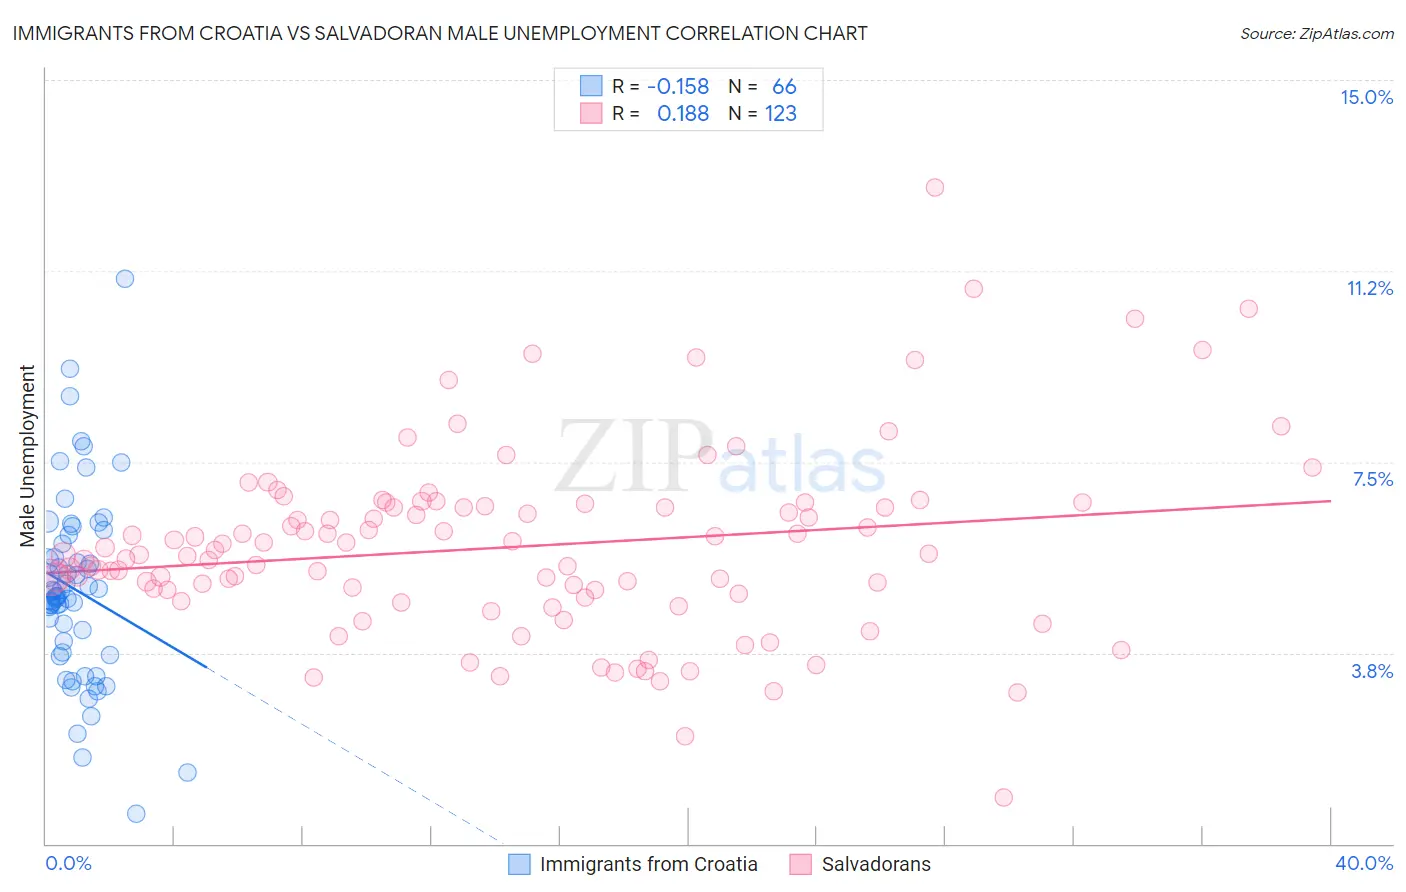
Immigrants from Croatia vs Salvadoran Male Unemployment Correlation Chart
The statistical analysis conducted on geographies consisting of 132,444,179 people shows a poor negative correlation between the proportion of Immigrants from Croatia and unemployment rate among males in the United States with a correlation coefficient (R) of -0.158 and weighted average of 5.2%. Similarly, the statistical analysis conducted on geographies consisting of 397,423,657 people shows a poor positive correlation between the proportion of Salvadorans and unemployment rate among males in the United States with a correlation coefficient (R) of 0.188 and weighted average of 5.7%, a difference of 8.9%.
Male Unemployment Correlation Summary
| Measurement | Immigrants from Croatia | Salvadoran |
| Minimum | 0.60% | 0.90% |
| Maximum | 11.1% | 12.9% |
| Range | 10.5% | 12.0% |
| Mean | 5.0% | 5.8% |
| Median | 4.9% | 5.7% |
| Interquartile 25% (IQ1) | 3.8% | 4.9% |
| Interquartile 75% (IQ3) | 5.9% | 6.6% |
| Interquartile Range (IQR) | 2.1% | 1.7% |
| Standard Deviation (Sample) | 1.8% | 1.8% |
| Standard Deviation (Population) | 1.8% | 1.8% |
Similar Demographics by Male Unemployment
Demographics Similar to Immigrants from Croatia by Male Unemployment
In terms of male unemployment, the demographic groups most similar to Immigrants from Croatia are Immigrants from Eastern Africa (5.2%, a difference of 0.010%), Lebanese (5.2%, a difference of 0.020%), Kenyan (5.2%, a difference of 0.020%), Brazilian (5.2%, a difference of 0.030%), and Immigrants from Saudi Arabia (5.2%, a difference of 0.040%).
| Demographics | Rating | Rank | Male Unemployment |
| Immigrants | Germany | 83.0 /100 | #131 | Excellent 5.2% |
| Chickasaw | 82.9 /100 | #132 | Excellent 5.2% |
| Colombians | 81.1 /100 | #133 | Excellent 5.2% |
| Pakistanis | 80.5 /100 | #134 | Excellent 5.2% |
| Immigrants | Saudi Arabia | 80.1 /100 | #135 | Excellent 5.2% |
| Lebanese | 79.9 /100 | #136 | Good 5.2% |
| Immigrants | Eastern Africa | 79.8 /100 | #137 | Good 5.2% |
| Immigrants | Croatia | 79.7 /100 | #138 | Good 5.2% |
| Kenyans | 79.4 /100 | #139 | Good 5.2% |
| Brazilians | 79.3 /100 | #140 | Good 5.2% |
| Immigrants | Switzerland | 79.2 /100 | #141 | Good 5.2% |
| Fijians | 78.3 /100 | #142 | Good 5.2% |
| Syrians | 78.0 /100 | #143 | Good 5.2% |
| Sri Lankans | 77.9 /100 | #144 | Good 5.2% |
| Macedonians | 77.7 /100 | #145 | Good 5.2% |
Demographics Similar to Salvadorans by Male Unemployment
In terms of male unemployment, the demographic groups most similar to Salvadorans are Immigrants from Cameroon (5.6%, a difference of 0.040%), Ottawa (5.7%, a difference of 0.070%), Immigrants from Guatemala (5.6%, a difference of 0.11%), Native Hawaiian (5.6%, a difference of 0.12%), and Honduran (5.6%, a difference of 0.16%).
| Demographics | Rating | Rank | Male Unemployment |
| Immigrants | Somalia | 1.5 /100 | #234 | Tragic 5.6% |
| Immigrants | Honduras | 1.5 /100 | #235 | Tragic 5.6% |
| Guatemalans | 1.2 /100 | #236 | Tragic 5.6% |
| Hondurans | 1.1 /100 | #237 | Tragic 5.6% |
| Native Hawaiians | 1.1 /100 | #238 | Tragic 5.6% |
| Immigrants | Guatemala | 1.1 /100 | #239 | Tragic 5.6% |
| Immigrants | Cameroon | 1.0 /100 | #240 | Tragic 5.6% |
| Salvadorans | 1.0 /100 | #241 | Tragic 5.7% |
| Ottawa | 0.9 /100 | #242 | Tragic 5.7% |
| Bangladeshis | 0.8 /100 | #243 | Tragic 5.7% |
| Immigrants | El Salvador | 0.7 /100 | #244 | Tragic 5.7% |
| Yaqui | 0.7 /100 | #245 | Tragic 5.7% |
| Iroquois | 0.6 /100 | #246 | Tragic 5.7% |
| Hawaiians | 0.6 /100 | #247 | Tragic 5.7% |
| Marshallese | 0.5 /100 | #248 | Tragic 5.7% |