Immigrants from Malaysia vs Salvadoran Male Unemployment
COMPARE
Immigrants from Malaysia
Salvadoran
Male Unemployment
Male Unemployment Comparison
Immigrants from Malaysia
Salvadorans
5.2%
MALE UNEMPLOYMENT
83.5/ 100
METRIC RATING
130th/ 347
METRIC RANK
5.7%
MALE UNEMPLOYMENT
1.0/ 100
METRIC RATING
241st/ 347
METRIC RANK
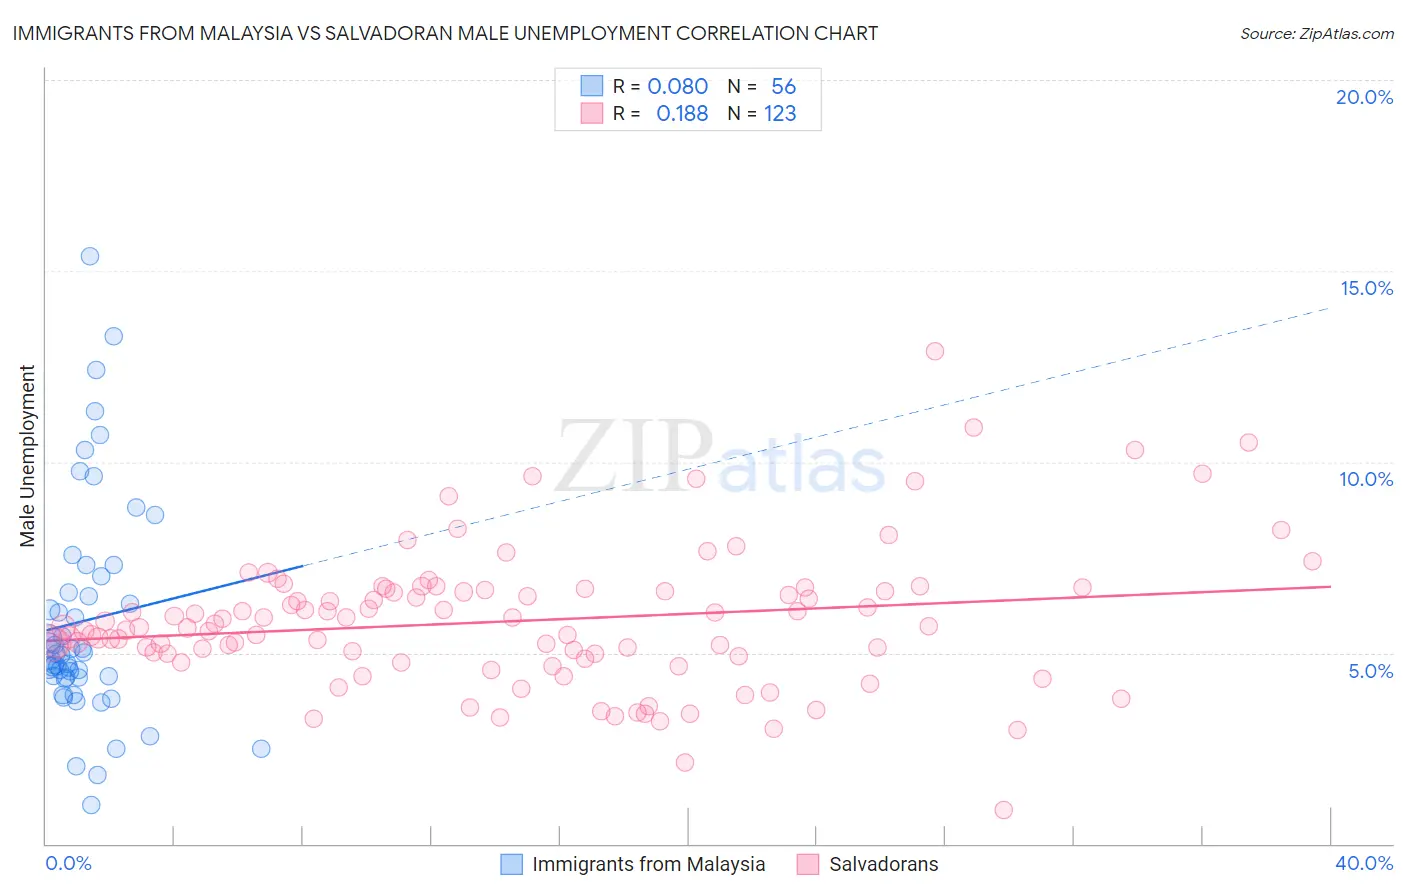
Immigrants from Malaysia vs Salvadoran Male Unemployment Correlation Chart
The statistical analysis conducted on geographies consisting of 197,762,289 people shows a slight positive correlation between the proportion of Immigrants from Malaysia and unemployment rate among males in the United States with a correlation coefficient (R) of 0.080 and weighted average of 5.2%. Similarly, the statistical analysis conducted on geographies consisting of 397,423,657 people shows a poor positive correlation between the proportion of Salvadorans and unemployment rate among males in the United States with a correlation coefficient (R) of 0.188 and weighted average of 5.7%, a difference of 9.3%.
Male Unemployment Correlation Summary
| Measurement | Immigrants from Malaysia | Salvadoran |
| Minimum | 1.0% | 0.90% |
| Maximum | 15.4% | 12.9% |
| Range | 14.4% | 12.0% |
| Mean | 5.8% | 5.8% |
| Median | 5.0% | 5.7% |
| Interquartile 25% (IQ1) | 4.4% | 4.9% |
| Interquartile 75% (IQ3) | 6.8% | 6.6% |
| Interquartile Range (IQR) | 2.4% | 1.7% |
| Standard Deviation (Sample) | 2.9% | 1.8% |
| Standard Deviation (Population) | 2.9% | 1.8% |
Similar Demographics by Male Unemployment
Demographics Similar to Immigrants from Malaysia by Male Unemployment
In terms of male unemployment, the demographic groups most similar to Immigrants from Malaysia are Immigrants from Germany (5.2%, a difference of 0.050%), Chickasaw (5.2%, a difference of 0.070%), Immigrants from Western Europe (5.2%, a difference of 0.15%), Hungarian (5.2%, a difference of 0.18%), and Colombian (5.2%, a difference of 0.25%).
| Demographics | Rating | Rank | Male Unemployment |
| Palestinians | 87.7 /100 | #123 | Excellent 5.1% |
| Immigrants | Latvia | 87.5 /100 | #124 | Excellent 5.1% |
| Immigrants | Lithuania | 87.2 /100 | #125 | Excellent 5.1% |
| Immigrants | Colombia | 86.8 /100 | #126 | Excellent 5.1% |
| Immigrants | Brazil | 86.3 /100 | #127 | Excellent 5.2% |
| Hungarians | 85.1 /100 | #128 | Excellent 5.2% |
| Immigrants | Western Europe | 84.8 /100 | #129 | Excellent 5.2% |
| Immigrants | Malaysia | 83.5 /100 | #130 | Excellent 5.2% |
| Immigrants | Germany | 83.0 /100 | #131 | Excellent 5.2% |
| Chickasaw | 82.9 /100 | #132 | Excellent 5.2% |
| Colombians | 81.1 /100 | #133 | Excellent 5.2% |
| Pakistanis | 80.5 /100 | #134 | Excellent 5.2% |
| Immigrants | Saudi Arabia | 80.1 /100 | #135 | Excellent 5.2% |
| Lebanese | 79.9 /100 | #136 | Good 5.2% |
| Immigrants | Eastern Africa | 79.8 /100 | #137 | Good 5.2% |
Demographics Similar to Salvadorans by Male Unemployment
In terms of male unemployment, the demographic groups most similar to Salvadorans are Immigrants from Cameroon (5.6%, a difference of 0.040%), Ottawa (5.7%, a difference of 0.070%), Immigrants from Guatemala (5.6%, a difference of 0.11%), Native Hawaiian (5.6%, a difference of 0.12%), and Honduran (5.6%, a difference of 0.16%).
| Demographics | Rating | Rank | Male Unemployment |
| Immigrants | Somalia | 1.5 /100 | #234 | Tragic 5.6% |
| Immigrants | Honduras | 1.5 /100 | #235 | Tragic 5.6% |
| Guatemalans | 1.2 /100 | #236 | Tragic 5.6% |
| Hondurans | 1.1 /100 | #237 | Tragic 5.6% |
| Native Hawaiians | 1.1 /100 | #238 | Tragic 5.6% |
| Immigrants | Guatemala | 1.1 /100 | #239 | Tragic 5.6% |
| Immigrants | Cameroon | 1.0 /100 | #240 | Tragic 5.6% |
| Salvadorans | 1.0 /100 | #241 | Tragic 5.7% |
| Ottawa | 0.9 /100 | #242 | Tragic 5.7% |
| Bangladeshis | 0.8 /100 | #243 | Tragic 5.7% |
| Immigrants | El Salvador | 0.7 /100 | #244 | Tragic 5.7% |
| Yaqui | 0.7 /100 | #245 | Tragic 5.7% |
| Iroquois | 0.6 /100 | #246 | Tragic 5.7% |
| Hawaiians | 0.6 /100 | #247 | Tragic 5.7% |
| Marshallese | 0.5 /100 | #248 | Tragic 5.7% |