Bolivian vs Ukrainian Unemployment
COMPARE
Bolivian
Ukrainian
Unemployment
Unemployment Comparison
Bolivians
Ukrainians
4.8%
UNEMPLOYMENT
99.7/ 100
METRIC RATING
38th/ 347
METRIC RANK
5.0%
UNEMPLOYMENT
96.0/ 100
METRIC RATING
93rd/ 347
METRIC RANK
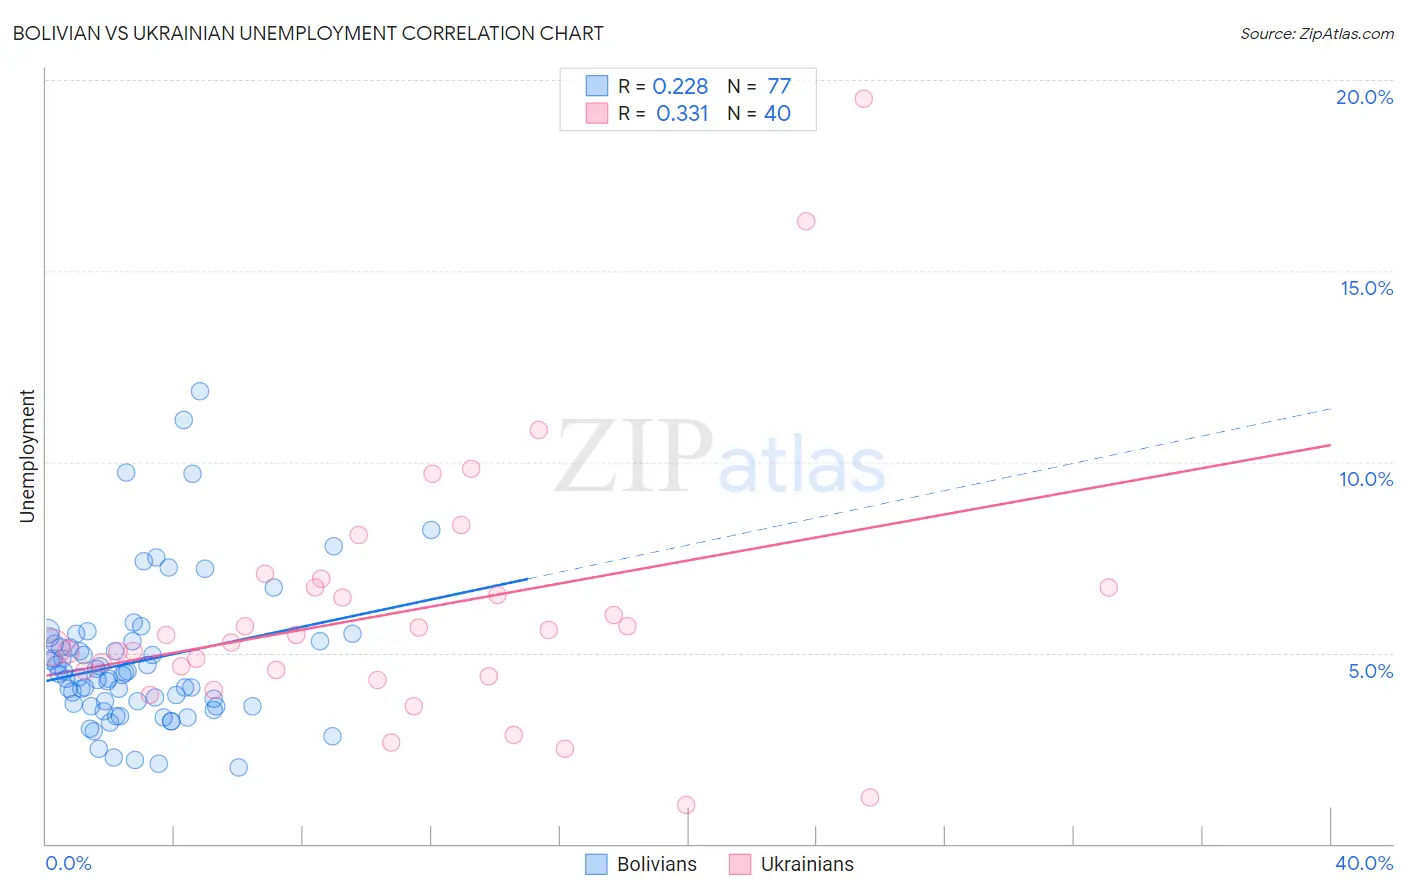
Bolivian vs Ukrainian Unemployment Correlation Chart
The statistical analysis conducted on geographies consisting of 184,629,958 people shows a weak positive correlation between the proportion of Bolivians and unemployment in the United States with a correlation coefficient (R) of 0.228 and weighted average of 4.8%. Similarly, the statistical analysis conducted on geographies consisting of 447,775,950 people shows a mild positive correlation between the proportion of Ukrainians and unemployment in the United States with a correlation coefficient (R) of 0.331 and weighted average of 5.0%, a difference of 4.4%.
Unemployment Correlation Summary
| Measurement | Bolivian | Ukrainian |
| Minimum | 2.0% | 1.0% |
| Maximum | 11.8% | 19.5% |
| Range | 9.8% | 18.5% |
| Mean | 4.8% | 6.0% |
| Median | 4.4% | 5.4% |
| Interquartile 25% (IQ1) | 3.6% | 4.5% |
| Interquartile 75% (IQ3) | 5.3% | 6.7% |
| Interquartile Range (IQR) | 1.7% | 2.2% |
| Standard Deviation (Sample) | 1.9% | 3.5% |
| Standard Deviation (Population) | 1.9% | 3.4% |
Similar Demographics by Unemployment
Demographics Similar to Bolivians by Unemployment
In terms of unemployment, the demographic groups most similar to Bolivians are Lithuanian (4.8%, a difference of 0.14%), Northern European (4.8%, a difference of 0.16%), Czechoslovakian (4.8%, a difference of 0.19%), Immigrants from Bosnia and Herzegovina (4.8%, a difference of 0.19%), and Tongan (4.8%, a difference of 0.26%).
| Demographics | Rating | Rank | Unemployment |
| Croatians | 99.8 /100 | #31 | Exceptional 4.8% |
| Zimbabweans | 99.8 /100 | #32 | Exceptional 4.8% |
| Sudanese | 99.8 /100 | #33 | Exceptional 4.8% |
| Immigrants | Bolivia | 99.8 /100 | #34 | Exceptional 4.8% |
| Scotch-Irish | 99.8 /100 | #35 | Exceptional 4.8% |
| Tongans | 99.7 /100 | #36 | Exceptional 4.8% |
| Czechoslovakians | 99.7 /100 | #37 | Exceptional 4.8% |
| Bolivians | 99.7 /100 | #38 | Exceptional 4.8% |
| Lithuanians | 99.7 /100 | #39 | Exceptional 4.8% |
| Northern Europeans | 99.7 /100 | #40 | Exceptional 4.8% |
| Immigrants | Bosnia and Herzegovina | 99.7 /100 | #41 | Exceptional 4.8% |
| Filipinos | 99.5 /100 | #42 | Exceptional 4.8% |
| Yugoslavians | 99.5 /100 | #43 | Exceptional 4.8% |
| Austrians | 99.5 /100 | #44 | Exceptional 4.8% |
| French | 99.5 /100 | #45 | Exceptional 4.8% |
Demographics Similar to Ukrainians by Unemployment
In terms of unemployment, the demographic groups most similar to Ukrainians are Immigrants from Austria (5.0%, a difference of 0.030%), Immigrants from South Africa (5.0%, a difference of 0.090%), Immigrants from Sudan (5.0%, a difference of 0.11%), Immigrants from North Macedonia (5.0%, a difference of 0.12%), and Jordanian (5.0%, a difference of 0.16%).
| Demographics | Rating | Rank | Unemployment |
| Hungarians | 96.9 /100 | #86 | Exceptional 5.0% |
| Immigrants | Moldova | 96.6 /100 | #87 | Exceptional 5.0% |
| Immigrants | Korea | 96.6 /100 | #88 | Exceptional 5.0% |
| Jordanians | 96.4 /100 | #89 | Exceptional 5.0% |
| Immigrants | North Macedonia | 96.3 /100 | #90 | Exceptional 5.0% |
| Immigrants | Sudan | 96.3 /100 | #91 | Exceptional 5.0% |
| Immigrants | South Africa | 96.2 /100 | #92 | Exceptional 5.0% |
| Ukrainians | 96.0 /100 | #93 | Exceptional 5.0% |
| Immigrants | Austria | 95.9 /100 | #94 | Exceptional 5.0% |
| Immigrants | Serbia | 95.6 /100 | #95 | Exceptional 5.0% |
| Immigrants | England | 95.2 /100 | #96 | Exceptional 5.0% |
| Immigrants | Czechoslovakia | 95.1 /100 | #97 | Exceptional 5.0% |
| Romanians | 95.0 /100 | #98 | Exceptional 5.0% |
| Mongolians | 94.8 /100 | #99 | Exceptional 5.0% |
| Estonians | 94.6 /100 | #100 | Exceptional 5.0% |