Immigrants from Northern Europe vs Immigrants from Sudan Unemployment
COMPARE
Immigrants from Northern Europe
Immigrants from Sudan
Unemployment
Unemployment Comparison
Immigrants from Northern Europe
Immigrants from Sudan
4.9%
UNEMPLOYMENT
98.2/ 100
METRIC RATING
74th/ 347
METRIC RANK
5.0%
UNEMPLOYMENT
96.3/ 100
METRIC RATING
91st/ 347
METRIC RANK
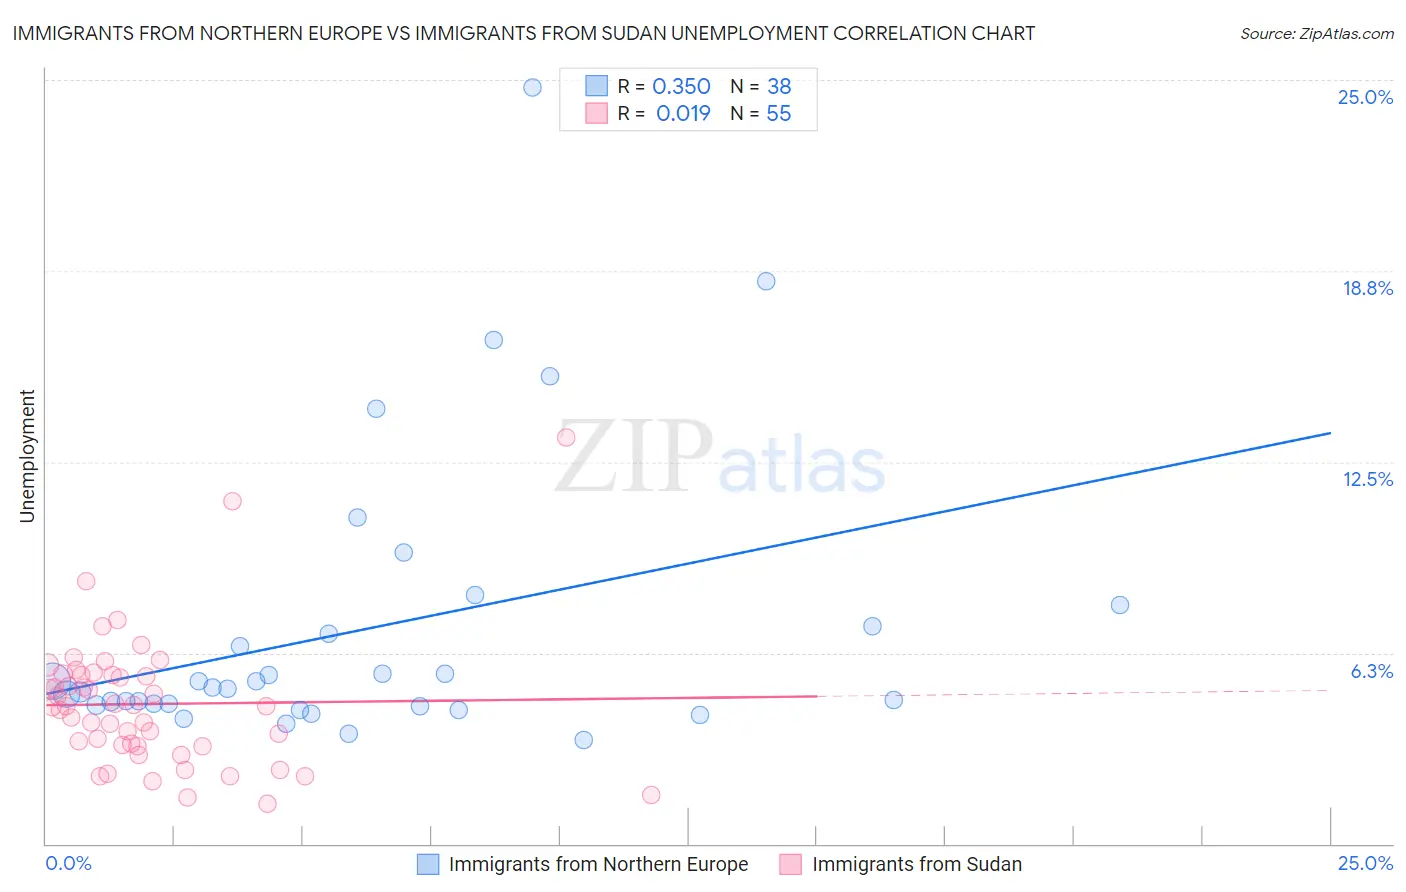
Immigrants from Northern Europe vs Immigrants from Sudan Unemployment Correlation Chart
The statistical analysis conducted on geographies consisting of 476,230,323 people shows a mild positive correlation between the proportion of Immigrants from Northern Europe and unemployment in the United States with a correlation coefficient (R) of 0.350 and weighted average of 4.9%. Similarly, the statistical analysis conducted on geographies consisting of 118,944,450 people shows no correlation between the proportion of Immigrants from Sudan and unemployment in the United States with a correlation coefficient (R) of 0.019 and weighted average of 5.0%, a difference of 1.2%.
Unemployment Correlation Summary
| Measurement | Immigrants from Northern Europe | Immigrants from Sudan |
| Minimum | 3.4% | 1.3% |
| Maximum | 24.8% | 13.3% |
| Range | 21.4% | 12.0% |
| Mean | 7.0% | 4.6% |
| Median | 5.1% | 4.5% |
| Interquartile 25% (IQ1) | 4.5% | 3.2% |
| Interquartile 75% (IQ3) | 7.1% | 5.5% |
| Interquartile Range (IQR) | 2.6% | 2.3% |
| Standard Deviation (Sample) | 4.7% | 2.2% |
| Standard Deviation (Population) | 4.7% | 2.2% |
Demographics Similar to Immigrants from Northern Europe and Immigrants from Sudan by Unemployment
In terms of unemployment, the demographic groups most similar to Immigrants from Northern Europe are Paraguayan (4.9%, a difference of 0.090%), Turkish (4.9%, a difference of 0.13%), Burmese (4.9%, a difference of 0.14%), German Russian (4.9%, a difference of 0.16%), and Cypriot (4.9%, a difference of 0.22%). Similarly, the demographic groups most similar to Immigrants from Sudan are Immigrants from North Macedonia (5.0%, a difference of 0.010%), Immigrants from South Africa (5.0%, a difference of 0.020%), Jordanian (5.0%, a difference of 0.050%), Immigrants from Korea (5.0%, a difference of 0.14%), and Immigrants from Moldova (5.0%, a difference of 0.17%).
| Demographics | Rating | Rank | Unemployment |
| Burmese | 98.3 /100 | #72 | Exceptional 4.9% |
| Paraguayans | 98.3 /100 | #73 | Exceptional 4.9% |
| Immigrants | Northern Europe | 98.2 /100 | #74 | Exceptional 4.9% |
| Turks | 98.0 /100 | #75 | Exceptional 4.9% |
| German Russians | 98.0 /100 | #76 | Exceptional 4.9% |
| Cypriots | 97.9 /100 | #77 | Exceptional 4.9% |
| Okinawans | 97.9 /100 | #78 | Exceptional 4.9% |
| Canadians | 97.7 /100 | #79 | Exceptional 5.0% |
| Immigrants | Sweden | 97.6 /100 | #80 | Exceptional 5.0% |
| Basques | 97.6 /100 | #81 | Exceptional 5.0% |
| Fijians | 97.6 /100 | #82 | Exceptional 5.0% |
| Hmong | 97.6 /100 | #83 | Exceptional 5.0% |
| Russians | 97.4 /100 | #84 | Exceptional 5.0% |
| Immigrants | Australia | 97.0 /100 | #85 | Exceptional 5.0% |
| Hungarians | 96.9 /100 | #86 | Exceptional 5.0% |
| Immigrants | Moldova | 96.6 /100 | #87 | Exceptional 5.0% |
| Immigrants | Korea | 96.6 /100 | #88 | Exceptional 5.0% |
| Jordanians | 96.4 /100 | #89 | Exceptional 5.0% |
| Immigrants | North Macedonia | 96.3 /100 | #90 | Exceptional 5.0% |
| Immigrants | Sudan | 96.3 /100 | #91 | Exceptional 5.0% |
| Immigrants | South Africa | 96.2 /100 | #92 | Exceptional 5.0% |