Black/African American vs Guyanese Unemployment Among Ages 60 to 64 years
COMPARE
Black/African American
Guyanese
Unemployment Among Ages 60 to 64 years
Unemployment Among Ages 60 to 64 years Comparison
Blacks/African Americans
Guyanese
5.3%
UNEMPLOYMENT AMONG AGES 60 TO 64 YEARS
0.0/ 100
METRIC RATING
294th/ 347
METRIC RANK
5.5%
UNEMPLOYMENT AMONG AGES 60 TO 64 YEARS
0.0/ 100
METRIC RATING
314th/ 347
METRIC RANK
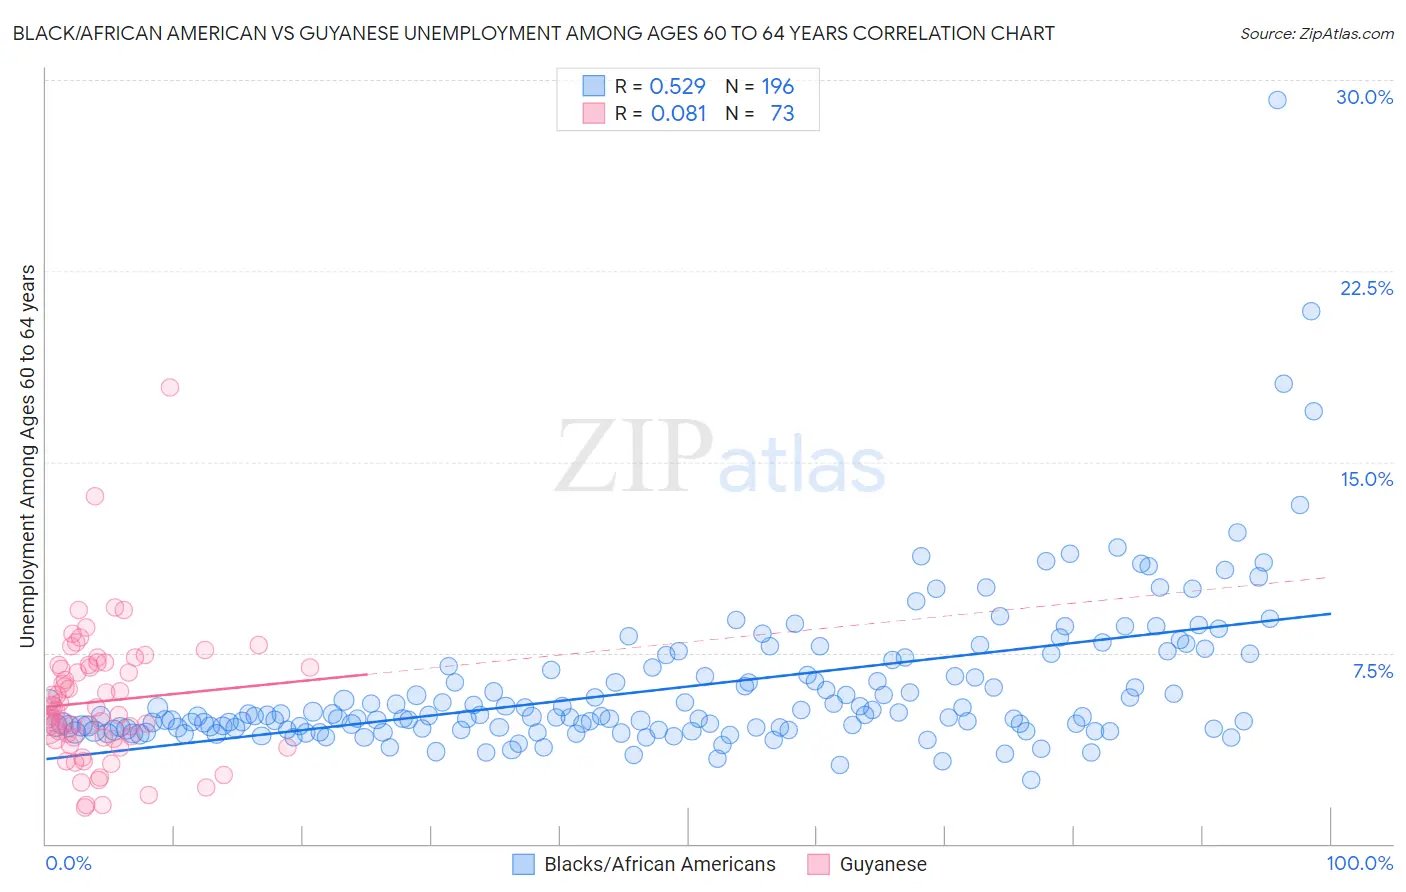
Black/African American vs Guyanese Unemployment Among Ages 60 to 64 years Correlation Chart
The statistical analysis conducted on geographies consisting of 465,577,423 people shows a substantial positive correlation between the proportion of Blacks/African Americans and unemployment rate among population between the ages 60 and 64 in the United States with a correlation coefficient (R) of 0.529 and weighted average of 5.3%. Similarly, the statistical analysis conducted on geographies consisting of 168,936,655 people shows a slight positive correlation between the proportion of Guyanese and unemployment rate among population between the ages 60 and 64 in the United States with a correlation coefficient (R) of 0.081 and weighted average of 5.5%, a difference of 3.8%.
Unemployment Among Ages 60 to 64 years Correlation Summary
| Measurement | Black/African American | Guyanese |
| Minimum | 2.5% | 1.4% |
| Maximum | 29.2% | 17.9% |
| Range | 26.7% | 16.5% |
| Mean | 6.1% | 5.6% |
| Median | 5.0% | 5.2% |
| Interquartile 25% (IQ1) | 4.5% | 4.1% |
| Interquartile 75% (IQ3) | 6.7% | 7.0% |
| Interquartile Range (IQR) | 2.2% | 2.9% |
| Standard Deviation (Sample) | 3.1% | 2.6% |
| Standard Deviation (Population) | 3.1% | 2.6% |
Demographics Similar to Blacks/African Americans and Guyanese by Unemployment Among Ages 60 to 64 years
In terms of unemployment among ages 60 to 64 years, the demographic groups most similar to Blacks/African Americans are Armenian (5.3%, a difference of 0.030%), Jamaican (5.3%, a difference of 0.15%), Osage (5.4%, a difference of 0.73%), Immigrants from Central America (5.4%, a difference of 0.78%), and Immigrants from El Salvador (5.4%, a difference of 0.83%). Similarly, the demographic groups most similar to Guyanese are Belizean (5.5%, a difference of 0.17%), Immigrants from West Indies (5.5%, a difference of 0.87%), U.S. Virgin Islander (5.5%, a difference of 1.1%), British West Indian (5.5%, a difference of 1.1%), and Spanish American Indian (5.4%, a difference of 2.0%).
| Demographics | Rating | Rank | Unemployment Among Ages 60 to 64 years |
| Blacks/African Americans | 0.0 /100 | #294 | Tragic 5.3% |
| Armenians | 0.0 /100 | #295 | Tragic 5.3% |
| Jamaicans | 0.0 /100 | #296 | Tragic 5.3% |
| Osage | 0.0 /100 | #297 | Tragic 5.4% |
| Immigrants | Central America | 0.0 /100 | #298 | Tragic 5.4% |
| Immigrants | El Salvador | 0.0 /100 | #299 | Tragic 5.4% |
| Immigrants | Barbados | 0.0 /100 | #300 | Tragic 5.4% |
| Immigrants | Jamaica | 0.0 /100 | #301 | Tragic 5.4% |
| Barbadians | 0.0 /100 | #302 | Tragic 5.4% |
| Bahamians | 0.0 /100 | #303 | Tragic 5.4% |
| Immigrants | Mexico | 0.0 /100 | #304 | Tragic 5.4% |
| Cypriots | 0.0 /100 | #305 | Tragic 5.4% |
| Immigrants | Dominica | 0.0 /100 | #306 | Tragic 5.4% |
| Immigrants | Guyana | 0.0 /100 | #307 | Tragic 5.4% |
| Spanish American Indians | 0.0 /100 | #308 | Tragic 5.4% |
| Soviet Union | 0.0 /100 | #309 | Tragic 5.4% |
| British West Indians | 0.0 /100 | #310 | Tragic 5.5% |
| U.S. Virgin Islanders | 0.0 /100 | #311 | Tragic 5.5% |
| Immigrants | West Indies | 0.0 /100 | #312 | Tragic 5.5% |
| Belizeans | 0.0 /100 | #313 | Tragic 5.5% |
| Guyanese | 0.0 /100 | #314 | Tragic 5.5% |