Filipino vs Guyanese Unemployment Among Ages 60 to 64 years
COMPARE
Filipino
Guyanese
Unemployment Among Ages 60 to 64 years
Unemployment Among Ages 60 to 64 years Comparison
Filipinos
Guyanese
4.8%
UNEMPLOYMENT AMONG AGES 60 TO 64 YEARS
72.1/ 100
METRIC RATING
155th/ 347
METRIC RANK
5.5%
UNEMPLOYMENT AMONG AGES 60 TO 64 YEARS
0.0/ 100
METRIC RATING
314th/ 347
METRIC RANK
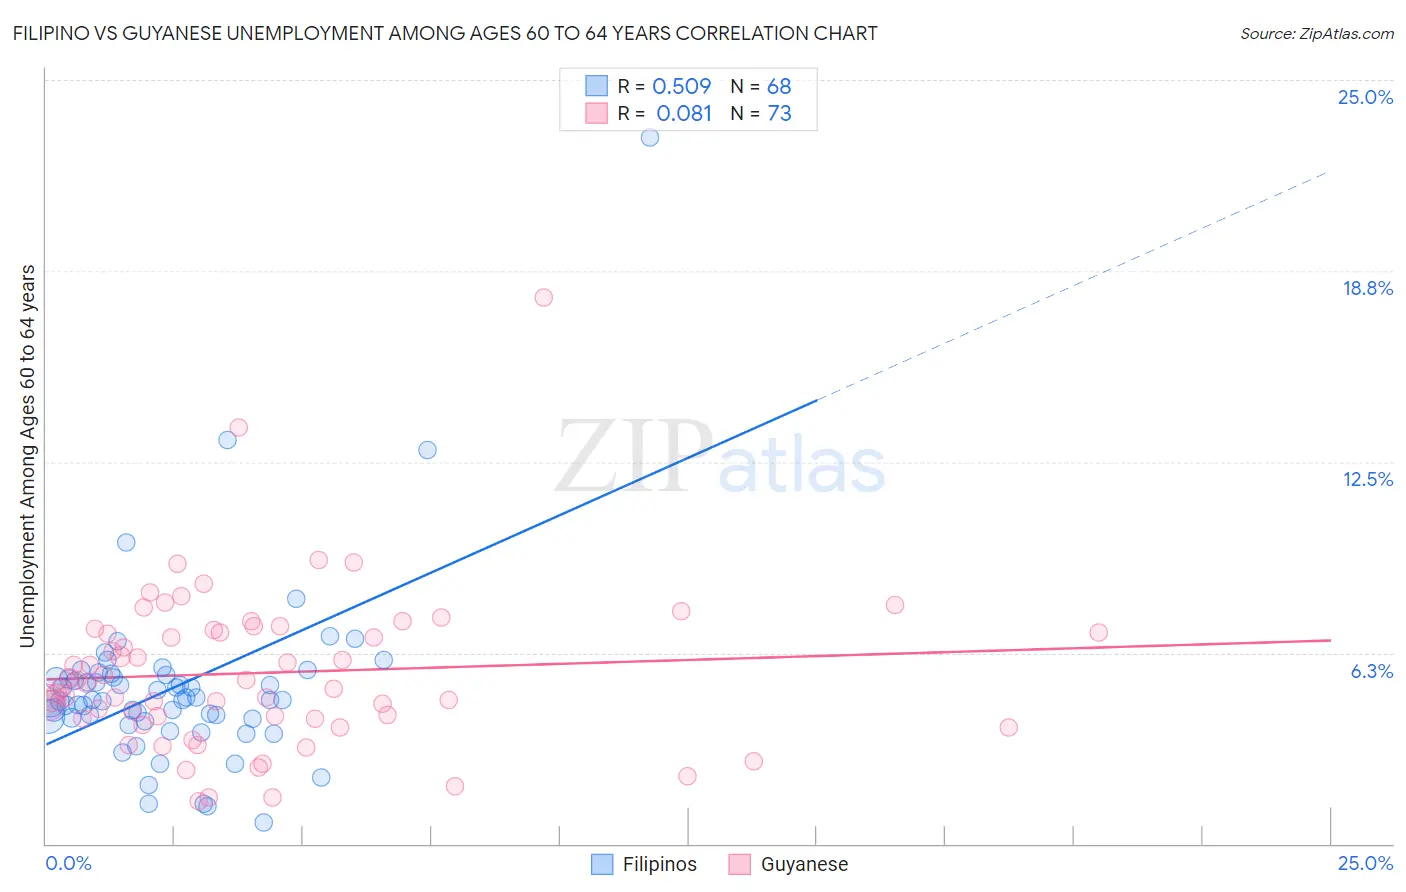
Filipino vs Guyanese Unemployment Among Ages 60 to 64 years Correlation Chart
The statistical analysis conducted on geographies consisting of 239,029,407 people shows a substantial positive correlation between the proportion of Filipinos and unemployment rate among population between the ages 60 and 64 in the United States with a correlation coefficient (R) of 0.509 and weighted average of 4.8%. Similarly, the statistical analysis conducted on geographies consisting of 168,936,655 people shows a slight positive correlation between the proportion of Guyanese and unemployment rate among population between the ages 60 and 64 in the United States with a correlation coefficient (R) of 0.081 and weighted average of 5.5%, a difference of 14.5%.
Unemployment Among Ages 60 to 64 years Correlation Summary
| Measurement | Filipino | Guyanese |
| Minimum | 0.70% | 1.4% |
| Maximum | 23.1% | 17.9% |
| Range | 22.4% | 16.5% |
| Mean | 5.1% | 5.6% |
| Median | 4.7% | 5.2% |
| Interquartile 25% (IQ1) | 4.1% | 4.1% |
| Interquartile 75% (IQ3) | 5.5% | 7.0% |
| Interquartile Range (IQR) | 1.4% | 2.9% |
| Standard Deviation (Sample) | 3.0% | 2.6% |
| Standard Deviation (Population) | 3.0% | 2.6% |
Similar Demographics by Unemployment Among Ages 60 to 64 years
Demographics Similar to Filipinos by Unemployment Among Ages 60 to 64 years
In terms of unemployment among ages 60 to 64 years, the demographic groups most similar to Filipinos are Chilean (4.8%, a difference of 0.020%), Immigrants from Bolivia (4.8%, a difference of 0.13%), Bolivian (4.8%, a difference of 0.16%), American (4.8%, a difference of 0.17%), and Laotian (4.8%, a difference of 0.22%).
| Demographics | Rating | Rank | Unemployment Among Ages 60 to 64 years |
| Latvians | 79.1 /100 | #148 | Good 4.8% |
| Arabs | 78.8 /100 | #149 | Good 4.8% |
| Immigrants | Italy | 78.7 /100 | #150 | Good 4.8% |
| Immigrants | South Africa | 78.5 /100 | #151 | Good 4.8% |
| Americans | 75.7 /100 | #152 | Good 4.8% |
| Bolivians | 75.5 /100 | #153 | Good 4.8% |
| Chileans | 72.6 /100 | #154 | Good 4.8% |
| Filipinos | 72.1 /100 | #155 | Good 4.8% |
| Immigrants | Bolivia | 69.2 /100 | #156 | Good 4.8% |
| Laotians | 66.8 /100 | #157 | Good 4.8% |
| Immigrants | Taiwan | 66.0 /100 | #158 | Good 4.8% |
| Spanish | 65.5 /100 | #159 | Good 4.8% |
| Australians | 65.3 /100 | #160 | Good 4.8% |
| Immigrants | Norway | 65.1 /100 | #161 | Good 4.8% |
| South Africans | 65.1 /100 | #162 | Good 4.8% |
Demographics Similar to Guyanese by Unemployment Among Ages 60 to 64 years
In terms of unemployment among ages 60 to 64 years, the demographic groups most similar to Guyanese are Belizean (5.5%, a difference of 0.17%), Immigrants from West Indies (5.5%, a difference of 0.87%), U.S. Virgin Islander (5.5%, a difference of 1.1%), British West Indian (5.5%, a difference of 1.1%), and Cree (5.6%, a difference of 1.3%).
| Demographics | Rating | Rank | Unemployment Among Ages 60 to 64 years |
| Immigrants | Guyana | 0.0 /100 | #307 | Tragic 5.4% |
| Spanish American Indians | 0.0 /100 | #308 | Tragic 5.4% |
| Soviet Union | 0.0 /100 | #309 | Tragic 5.4% |
| British West Indians | 0.0 /100 | #310 | Tragic 5.5% |
| U.S. Virgin Islanders | 0.0 /100 | #311 | Tragic 5.5% |
| Immigrants | West Indies | 0.0 /100 | #312 | Tragic 5.5% |
| Belizeans | 0.0 /100 | #313 | Tragic 5.5% |
| Guyanese | 0.0 /100 | #314 | Tragic 5.5% |
| Cree | 0.0 /100 | #315 | Tragic 5.6% |
| Cheyenne | 0.0 /100 | #316 | Tragic 5.6% |
| Shoshone | 0.0 /100 | #317 | Tragic 5.7% |
| Natives/Alaskans | 0.0 /100 | #318 | Tragic 5.7% |
| Immigrants | Belize | 0.0 /100 | #319 | Tragic 5.7% |
| Colville | 0.0 /100 | #320 | Tragic 5.7% |
| Dutch West Indians | 0.0 /100 | #321 | Tragic 5.7% |