Black/African American vs Guyanese Seniors Poverty Over the Age of 75
COMPARE
Black/African American
Guyanese
Seniors Poverty Over the Age of 75
Seniors Poverty Over the Age of 75 Comparison
Blacks/African Americans
Guyanese
14.6%
SENIORS POVERTY OVER THE AGE OF 75
0.0/ 100
METRIC RATING
279th/ 347
METRIC RANK
16.1%
SENIORS POVERTY OVER THE AGE OF 75
0.0/ 100
METRIC RATING
315th/ 347
METRIC RANK
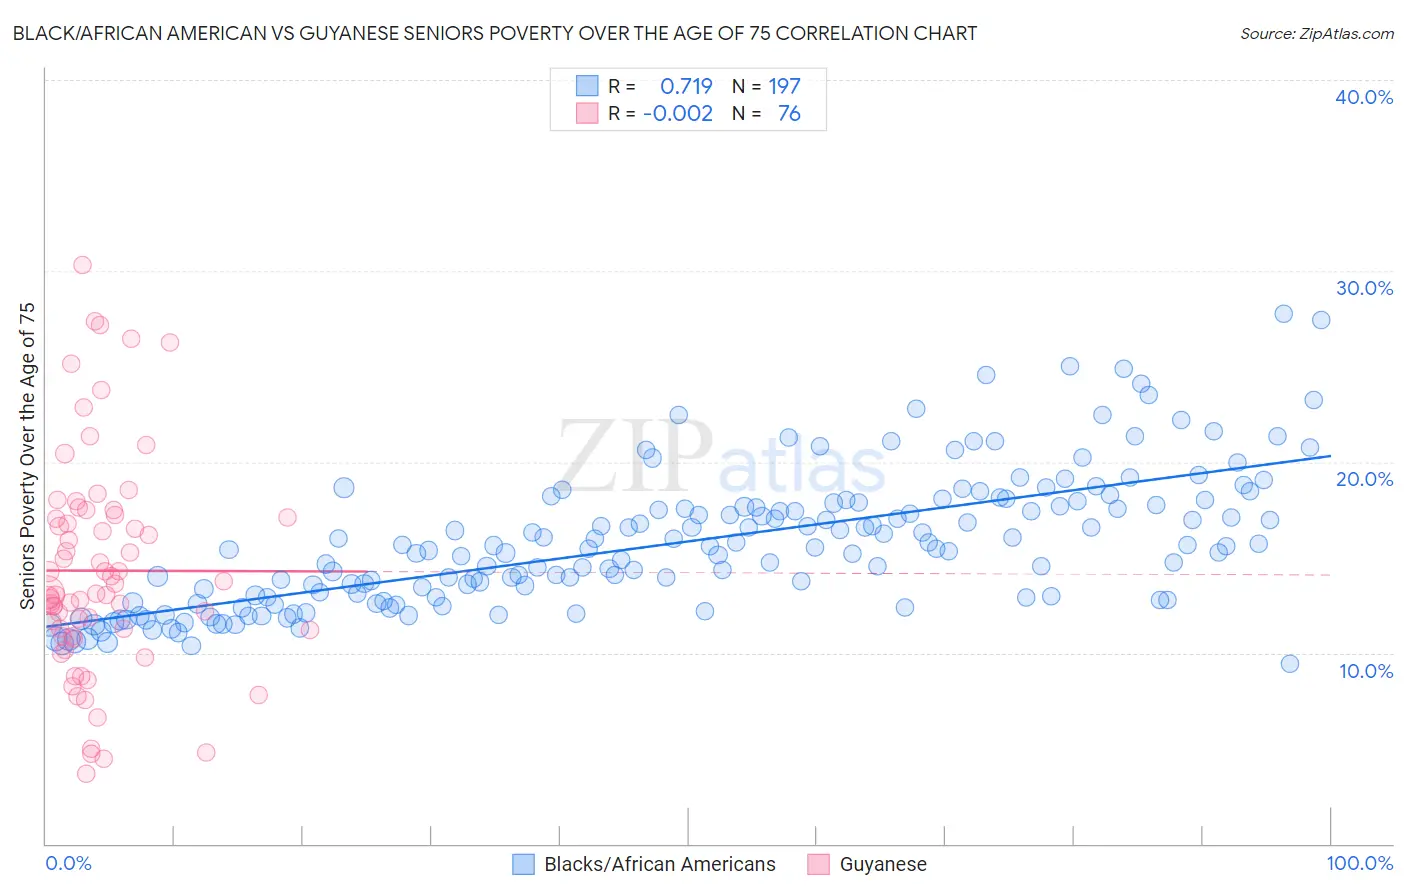
Black/African American vs Guyanese Seniors Poverty Over the Age of 75 Correlation Chart
The statistical analysis conducted on geographies consisting of 551,157,628 people shows a strong positive correlation between the proportion of Blacks/African Americans and poverty level among seniors over the age of 75 in the United States with a correlation coefficient (R) of 0.719 and weighted average of 14.6%. Similarly, the statistical analysis conducted on geographies consisting of 175,791,386 people shows no correlation between the proportion of Guyanese and poverty level among seniors over the age of 75 in the United States with a correlation coefficient (R) of -0.002 and weighted average of 16.1%, a difference of 10.1%.
Seniors Poverty Over the Age of 75 Correlation Summary
| Measurement | Black/African American | Guyanese |
| Minimum | 9.4% | 3.7% |
| Maximum | 27.7% | 30.3% |
| Range | 18.3% | 26.6% |
| Mean | 15.8% | 14.3% |
| Median | 15.4% | 13.1% |
| Interquartile 25% (IQ1) | 12.9% | 11.0% |
| Interquartile 75% (IQ3) | 17.8% | 17.1% |
| Interquartile Range (IQR) | 4.9% | 6.1% |
| Standard Deviation (Sample) | 3.5% | 5.7% |
| Standard Deviation (Population) | 3.5% | 5.6% |
Similar Demographics by Seniors Poverty Over the Age of 75
Demographics Similar to Blacks/African Americans by Seniors Poverty Over the Age of 75
In terms of seniors poverty over the age of 75, the demographic groups most similar to Blacks/African Americans are Immigrants from Colombia (14.6%, a difference of 0.21%), Central American (14.7%, a difference of 0.64%), Belizean (14.8%, a difference of 0.76%), Immigrants from Senegal (14.8%, a difference of 0.93%), and Senegalese (14.5%, a difference of 0.99%).
| Demographics | Rating | Rank | Seniors Poverty Over the Age of 75 |
| Mexicans | 0.0 /100 | #272 | Tragic 14.4% |
| Immigrants | South America | 0.0 /100 | #273 | Tragic 14.4% |
| Immigrants | Bahamas | 0.0 /100 | #274 | Tragic 14.4% |
| Immigrants | El Salvador | 0.0 /100 | #275 | Tragic 14.5% |
| Soviet Union | 0.0 /100 | #276 | Tragic 14.5% |
| Senegalese | 0.0 /100 | #277 | Tragic 14.5% |
| Immigrants | Colombia | 0.0 /100 | #278 | Tragic 14.6% |
| Blacks/African Americans | 0.0 /100 | #279 | Tragic 14.6% |
| Central Americans | 0.0 /100 | #280 | Tragic 14.7% |
| Belizeans | 0.0 /100 | #281 | Tragic 14.8% |
| Immigrants | Senegal | 0.0 /100 | #282 | Tragic 14.8% |
| Guatemalans | 0.0 /100 | #283 | Tragic 14.8% |
| Cheyenne | 0.0 /100 | #284 | Tragic 14.9% |
| Immigrants | Mexico | 0.0 /100 | #285 | Tragic 14.9% |
| Immigrants | Central America | 0.0 /100 | #286 | Tragic 15.0% |
Demographics Similar to Guyanese by Seniors Poverty Over the Age of 75
In terms of seniors poverty over the age of 75, the demographic groups most similar to Guyanese are Immigrants from Ecuador (16.1%, a difference of 0.010%), Tsimshian (16.1%, a difference of 0.30%), Immigrants from Guyana (16.2%, a difference of 0.62%), Barbadian (16.0%, a difference of 0.66%), and Houma (16.2%, a difference of 0.75%).
| Demographics | Rating | Rank | Seniors Poverty Over the Age of 75 |
| Immigrants | Bangladesh | 0.0 /100 | #308 | Tragic 15.8% |
| Yup'ik | 0.0 /100 | #309 | Tragic 15.8% |
| Vietnamese | 0.0 /100 | #310 | Tragic 15.9% |
| Trinidadians and Tobagonians | 0.0 /100 | #311 | Tragic 15.9% |
| Crow | 0.0 /100 | #312 | Tragic 15.9% |
| Barbadians | 0.0 /100 | #313 | Tragic 16.0% |
| Tsimshian | 0.0 /100 | #314 | Tragic 16.1% |
| Guyanese | 0.0 /100 | #315 | Tragic 16.1% |
| Immigrants | Ecuador | 0.0 /100 | #316 | Tragic 16.1% |
| Immigrants | Guyana | 0.0 /100 | #317 | Tragic 16.2% |
| Houma | 0.0 /100 | #318 | Tragic 16.2% |
| Haitians | 0.0 /100 | #319 | Tragic 16.2% |
| Immigrants | Yemen | 0.0 /100 | #320 | Tragic 16.5% |
| Immigrants | Haiti | 0.0 /100 | #321 | Tragic 16.5% |
| Immigrants | Barbados | 0.0 /100 | #322 | Tragic 16.5% |