Black/African American vs Guyanese Unemployment Among Ages 55 to 59 years
COMPARE
Black/African American
Guyanese
Unemployment Among Ages 55 to 59 years
Unemployment Among Ages 55 to 59 years Comparison
Blacks/African Americans
Guyanese
5.5%
UNEMPLOYMENT AMONG AGES 55 TO 59 YEARS
0.0/ 100
METRIC RATING
304th/ 347
METRIC RANK
5.7%
UNEMPLOYMENT AMONG AGES 55 TO 59 YEARS
0.0/ 100
METRIC RATING
315th/ 347
METRIC RANK
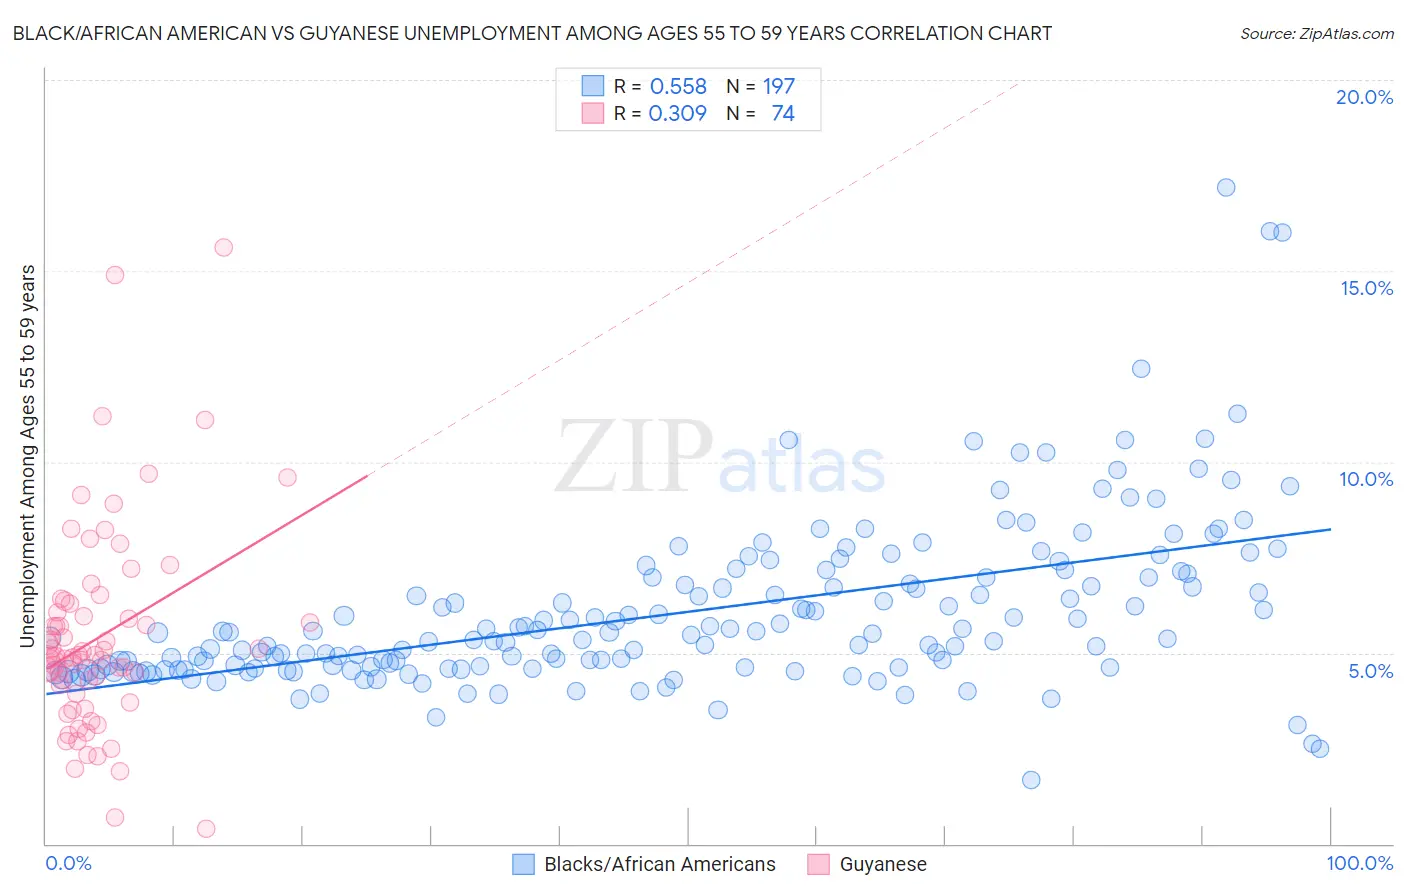
Black/African American vs Guyanese Unemployment Among Ages 55 to 59 years Correlation Chart
The statistical analysis conducted on geographies consisting of 486,654,676 people shows a substantial positive correlation between the proportion of Blacks/African Americans and unemployment rate among population between the ages 55 and 59 in the United States with a correlation coefficient (R) of 0.558 and weighted average of 5.5%. Similarly, the statistical analysis conducted on geographies consisting of 171,113,003 people shows a mild positive correlation between the proportion of Guyanese and unemployment rate among population between the ages 55 and 59 in the United States with a correlation coefficient (R) of 0.309 and weighted average of 5.7%, a difference of 3.1%.
Unemployment Among Ages 55 to 59 years Correlation Summary
| Measurement | Black/African American | Guyanese |
| Minimum | 1.7% | 0.40% |
| Maximum | 17.2% | 15.6% |
| Range | 15.5% | 15.2% |
| Mean | 6.0% | 5.4% |
| Median | 5.4% | 4.9% |
| Interquartile 25% (IQ1) | 4.6% | 3.9% |
| Interquartile 75% (IQ3) | 7.0% | 6.3% |
| Interquartile Range (IQR) | 2.4% | 2.4% |
| Standard Deviation (Sample) | 2.2% | 2.7% |
| Standard Deviation (Population) | 2.2% | 2.7% |
Demographics Similar to Blacks/African Americans and Guyanese by Unemployment Among Ages 55 to 59 years
In terms of unemployment among ages 55 to 59 years, the demographic groups most similar to Blacks/African Americans are Immigrants from Portugal (5.5%, a difference of 0.17%), Immigrants from Cabo Verde (5.5%, a difference of 0.29%), Immigrants from Belize (5.5%, a difference of 0.51%), Marshallese (5.5%, a difference of 0.52%), and Sierra Leonean (5.5%, a difference of 0.53%). Similarly, the demographic groups most similar to Guyanese are Tlingit-Haida (5.7%, a difference of 0.15%), Immigrants from Ecuador (5.7%, a difference of 0.20%), Hmong (5.7%, a difference of 0.42%), Central American Indian (5.6%, a difference of 0.44%), and Ecuadorian (5.6%, a difference of 0.63%).
| Demographics | Rating | Rank | Unemployment Among Ages 55 to 59 years |
| Cape Verdeans | 0.0 /100 | #299 | Tragic 5.4% |
| Immigrants | St. Vincent and the Grenadines | 0.0 /100 | #300 | Tragic 5.4% |
| Immigrants | Dominica | 0.0 /100 | #301 | Tragic 5.5% |
| Sierra Leoneans | 0.0 /100 | #302 | Tragic 5.5% |
| Marshallese | 0.0 /100 | #303 | Tragic 5.5% |
| Blacks/African Americans | 0.0 /100 | #304 | Tragic 5.5% |
| Immigrants | Portugal | 0.0 /100 | #305 | Tragic 5.5% |
| Immigrants | Cabo Verde | 0.0 /100 | #306 | Tragic 5.5% |
| Immigrants | Belize | 0.0 /100 | #307 | Tragic 5.5% |
| Spanish American Indians | 0.0 /100 | #308 | Tragic 5.6% |
| Nepalese | 0.0 /100 | #309 | Tragic 5.6% |
| Belizeans | 0.0 /100 | #310 | Tragic 5.6% |
| Houma | 0.0 /100 | #311 | Tragic 5.6% |
| Ecuadorians | 0.0 /100 | #312 | Tragic 5.6% |
| Central American Indians | 0.0 /100 | #313 | Tragic 5.6% |
| Tlingit-Haida | 0.0 /100 | #314 | Tragic 5.7% |
| Guyanese | 0.0 /100 | #315 | Tragic 5.7% |
| Immigrants | Ecuador | 0.0 /100 | #316 | Tragic 5.7% |
| Hmong | 0.0 /100 | #317 | Tragic 5.7% |
| Immigrants | Guyana | 0.0 /100 | #318 | Tragic 5.8% |
| Kiowa | 0.0 /100 | #319 | Tragic 5.8% |